
SG Mart FY25 Results: PAT up 70%, Eyes 4X PAT by FY27
Guides 2× EBITDA in FY26 & 4× by FY27—solar, service centers, and royalty model hold the key to the growth. Opportunity at 12× FY27 PE if guidance is delivered
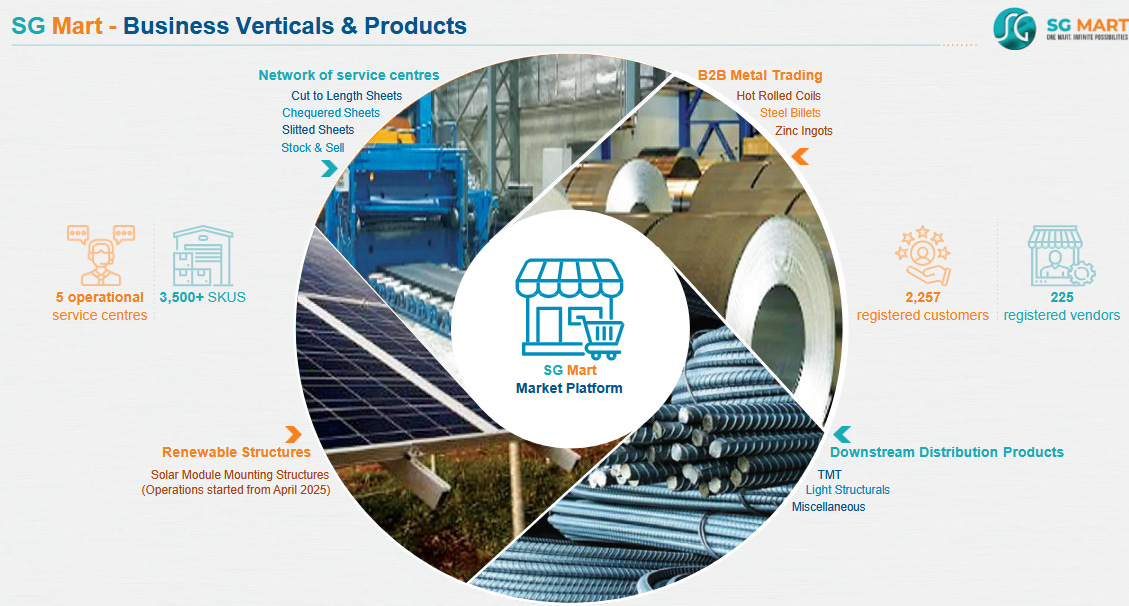
1. B2B Market-place for Construction Materials
sgmart.co.in | BOM : 512329
SG Mart Business was started in June 2023.
Goal is to buy steel in bulk and become the largest buyer of steel in the country.
Segregated our sales into three verticals for raw steel, which we are buying from steel mills.
B2B metal trading: We buy in bulk; we sell in bulk to large clients.
Service centres where some mild processing is done for the steel.
Sell steel in form of solar structures. Again, this is mild processing.
Idea is to process steel in same way and get extra margin over it because the B2B trading always will have limited margin but when we do mild processing and service the industry, the margins become 2x and 3x, and it adds up to the ROC
Distribution business, which was established to leverage the network of downstream steel distributors of the APL Apollo Group.
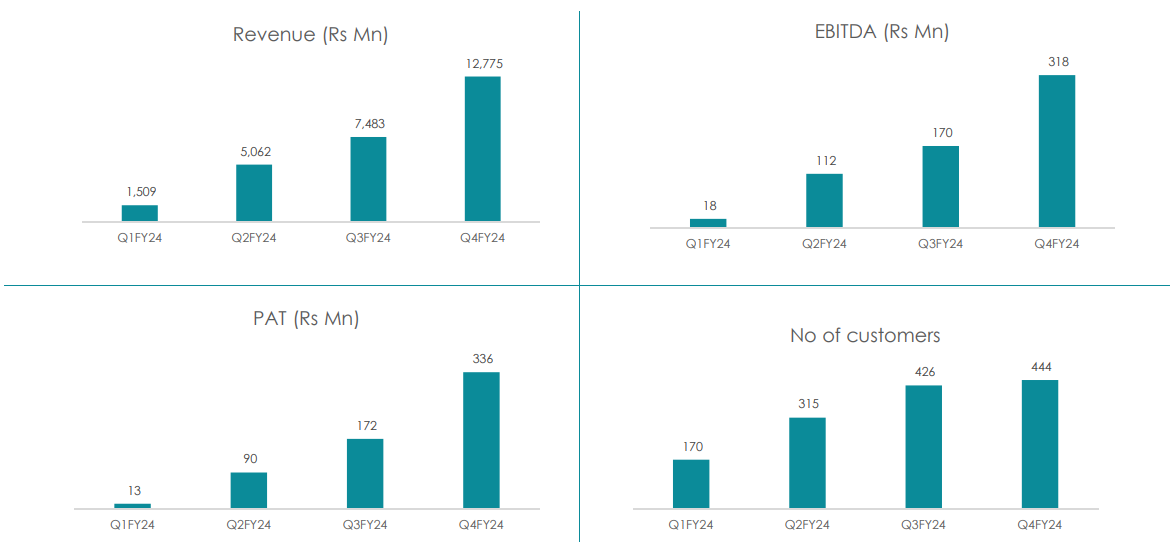
2. FY24: QoQ growth in PAT & Revenue in all quarters
FY24 (First year of operation)

3. Q4-25: PAT down 1% & Revenue up 25% YoY
Flat PAT & Revenue up 20% QoQ

Emergence of a multi-vertical, asset-light platform:
SG Mart’s TMT business shifted to a royalty model:
Partners with regional TMT makers; Sells under “APL Apollo SG TMT” brand
Earns ₹500/ton royalty — no working capital, inventory, or credit risk
Management expects royalty to rise to ₹750–1,000/ton as brand scales.
Revenue is pure fee income — By FY27, this could contribute ₹200–300 Cr EBITDA — with zero capex.
Service centres operationalized → value-added processing for higher-margin sales.
Solar structures business initiated (orders booked, production to start FY26).
These verticals added margin layers on top of base trading.
Impact in Q4 FY25:
EBITDA up 39% QoQ despite just 20% revenue growth → clear sign of operating leverage and better mix.
EBITDA margin improved from 2.1% → 2.4%.
4. FY25: PAT Up 70% & Revenue Up 118%

Revenue: Scale-up across all business verticals. B2B metal trading, service centres, and distribution drove top-line growth.
EBITDA: Higher overheads (branding, infra, team scale-up), and forex reclassification into other income.
EBITDA Margin: Margin compression from business mix and execution costs.
PAT: Strong net income growth, aided by high other income and tight control
PAT Margin: Similar margin trend as EBITDA. Improved in Q4, but full-year margin reflects early-stage scaling pains.
5. Business Metrics: Strong Return Ratios

FY25 reflects a scaling year: revenue and operations expanded, but capital efficiency fell.
Temporary working capital spike inflated capital employed, dragging ROCE.
The increase in Net WC days is primarily due to an advance payment of Rs. 1,507Mn made to steel suppliers towards the end of March 25 for bulk procurement of raw materials ahead of implementation of import tariffs
ROE improvement is positive but suggests there's more room for profitability growth.
The balance sheet remains strong (net cash position) even after growth investments.
Key Watch Areas for FY26
NWC normalization to 10–15 days → should restore capital efficiency.
ROCE recovery expected as asset base sweats better (esp. service centres).
Warrant conversion inflow (₹250 Cr) → equity base will rise → needs strong PAT growth to sustain/improve ROE.
6. Outlook: EBITDA CAGR of 97% for FY25-27
6.1 FY25 Performance vs. Expectations
✅ Hits: What Went Right
Strong Revenue Growth: Revenue more than doubled driven by solar EPC, service centres, and TMT brand-led volume expansion
Profitability Growth: PAT grew +70% YoY & EBITDA grew +67%
Asset-Light Royalty Model Execution: SG Mart launched TMT under a royalty model (APL Apollo SG TMT)
Emerging Solar + Infra Flywheel:
Solar EPC and service centre businesses created visibility for volume-linked margin expansion
Future outlook implies high revenue productivity from non-capex models
❌ Misses: What Fell Short
Margin Compression
EBITDA and PAT margins declined by 50 bps each:
6.2 Management Guidance — FY26 & FY27
EBITDA: I can tell you with full confidence that this EBITDA of INR100 crores will grow to INR200 crores in FY '26 and INR400 crores in FY '27.
ROCE: As we double our business every year in terms of expansion in each of the verticals. And this will be coupled with minimum threshold of 25%
PAT Growth: With this when we guide for 100% growth in EBITDA, same 100% growth in PAT also you will see.
Business Vertical Outlook
B2B Metal Trading
FY25: 6.3 Lakh tons → FY26: 50% growth expected
Still the volume engine; margins thin but predictable
Visibility from domestic steel capacity expansions
Network of Service Centres
FY25: 5 centres → FY26: add 5 more → FY27: add 5–7 more
High-ROCE vertical (target 25%+), EBITDA ~₹2,000/ton
Key to margin expansion and regional reach
Downstream Distribution (TMT + Non-TMT)
Shift to royalty-based model = no inventory risk, high-margin revenue
FY26 TMT volume: 1.8L tons at ₹500/ton royalty
Target royalty ramp-up: ₹750–₹1,000/ton
Non-TMT revenue target: ₹1,000 Cr in FY26
Renewable Structures
FY26: execute 50,000 tons (orders in hand)
FY27: expected to double
High EBITDA (~₹3,000–₹4,000/ton), minimal capex
Exports to UAE, Gulf regions under exploration
7. Valuation Analysis — SG Mart
7.1 Valuation Snapshot
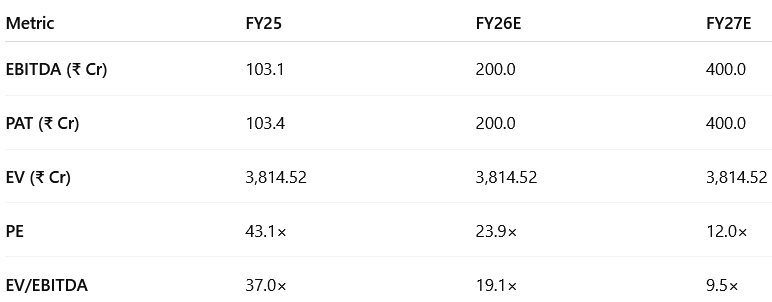
PAT and EBITDA doubling assumed each year, based on management guidance.
P/E calculated using post-dilution share base of 12.6 Cr.
In May 2025, SG Mart Ltd. allotted 1,36,18,000 equity shares upon conversion of 6,80,900 warrants. This increased the company's share capital to 12,60,00,000 shares.
7.2 What’s in the Price?
The current valuation (~43× P/E TTM, ~24× forward P/E) reflects high confidence in execution through FY26–27.
FY26 PAT of ₹200 Cr and 2× YoY EBITDA/PAT growth are fully priced in.
Sustained growth into FY27 implies a forward P/E of ~12×, which is already pricing in long-term scalability.
Implied valuation assumes:
Successful execution of solar structure orders (50,000 tons in FY26)
5–7 additional service centres ramp up on time
TMT royalty business scales without margin erosion
Working capital normalization and margin recovery hold
💡 Full earnings monetization is priced in by FY27, leaving limited margin for execution slip-ups. Any under-delivery on growth, mix, or asset utilization could trigger a sharp de-rating.
7.3 What’s Not in the Price?
Several upside levers remain underappreciated by the market:
Dubai & Export Potential: Dubai SC already contributes ₹600–₹700 Cr run-rate. No value assigned yet to export ramp-up or Gulf/Southeast Asia expansion.
Solar Margin Upside: Solar vertical offers ₹3,000–₹4,000/ton EBITDA — materially higher than blended business — but zero valuation credit as of FY25.
Royalty Model Leverage: As APL Apollo-backed TMT expands, per-ton royalty may move from ₹500 to ₹1,000 — doubling margin without capital employed.
Optionality in Asset-light Expansion: Distribution partnerships, e-commerce, or private-label moves could unlock low-capex growth. Not priced in.
Valuation Re-rating: If ROCE sustains above 25% & margin profile matures, the stock could re-rate to 28–30× forward P/E — currently trading at ~12× FY27E P/E
7.4 Risks and What to Monitor
🧨 The market is pricing in near-flawless execution — any slippage could compress valuation rapidly.
Execution Risk: Service centre ramp-up, solar structure delivery, or TMT royalty partner performance falling short could derail FY26/FY27 targets.
Input Volatility: Steel price fluctuations or inventory misalignment could squeeze gross margins.
Working Capital Risk: FY25 closed with 30-day NWC stretch. Delays in receivable recovery or advance utilization could pressure liquidity.
Regulatory Risk: Government tariffs, trade policies, or anti-dumping duties could alter procurement economics — especially for imports or exports.
Customer Concentration: B2B volumes are still reliant on a few large buyers; demand shocks from any sector (e.g., solar, infra) may impact throughput.
No Equity Cushion: Valuation assumes self-funded growth — any future equity raise or M&A could temporarily distort per-share metrics.
What to Monitor

8. Implications for Investors
8.1 Bull, Base & Bear Scenarios — SG Mart

Key Swing Factors
Execution at Scale: Timely activation and utilization of 5–7 new service centres by FY27 is essential to justify PAT targets.
Royalty Model Realization: Upside hinges on per-ton royalty rising to ₹750–₹1,000 by FY27. This is margin accretive without added capex.
Solar Margin Capture: 50,000+ tons of solar structures at ₹3,000–4,000/ton EBITDA could double profit contribution from FY26.
Working Capital Management: Post-FY25 spike to 30 days, sustained normalization to <15 days is critical to fund growth internally.
Valuation Re-rating: Forward P/E could re-rate from 12× FY27E to 18–20× if SG Mart proves its capital efficiency and platform scale.
8.2 Is There Any Margin of Safety?
✅ Where There Is Margin of Safety
Business Quality & Model
Diversified across four growth levers: B2B trading, service centres, solar structures, and TMT royalty — each scaling with distinct margin/volume dynamics.
Asset-light components (TMT royalty and solar) offer high EBITDA/ton without balance sheet risk.
FY25 EBITDA margins already recovering in Q4 (2.4%), with stronger contribution expected from high-value verticals.
Capital Structure
Net cash position of ₹455.8 Cr at FY25-end, with no debt funding required for ₹600 Cr capex plan.
₹250 Cr of fresh equity via warrant conversion already secured in FY26, no further dilution assumed.
Management guided that all expansion is fully funded from internal accruals, with no QIP or external raise needed in the base case.
Execution Levers Not Yet Priced In
Solar vertical (₹3,000–4,000/ton EBITDA) could double FY26 operating profit with only 50,000 tons of execution.
Royalty/ton in TMT currently at ₹500 — if this ramps to ₹750–₹1,000 as guided, incremental EBITDA will flow directly to bottom line.
Export vertical via Dubai SC and new Gulf/Southeast Asia relationships remain unmodeled in current valuations.
FY27 PAT of ₹400 Cr is not pricing in margin tailwinds or operating leverage upside from newly launched SCs.
If these levers play out, FY27–28 earnings could come in at 9–10× forward P/E, effectively locking in multiple years of growth at today’s valuation.
❌ Where There Isn’t Margin of Safety
Valuation is Still Full
FY25 P/E of 43×, FY26 forward P/E of ~24× assumes high probability of perfect execution.
EV/EBITDA of 37× on trailing, 19× on forward basis still leaves little room for misses — especially compared to industry median of 10–15×.
Execution Risks Persist
Multi-vertical scale-up raises operational complexity — slippage in any one (solar ramp-up, SC utilization, or TMT partner execution) could impair consolidated margins.
Working capital stretch in FY25 (30 days) must normalize; any delay may increase funding pressure or reduce flexibility.
Valuation assumes no dilution — any deviation from self-funded growth (e.g., M&A or one-off investment) could disrupt EPS trajectory.
No Cushion for Disappointment
If FY26 PAT or EBITDA comes in below guidance, P/E could quickly compress to 15–18×, especially with weak margin trends or working capital drag.
Street is giving credit for scale + profitability — any failure to deliver both simultaneously could trigger sharp de-rating.
Margin of safety lies more in the business model than in the stock price.
You're paying ~24× FY26 forward earnings for a platform with diversified revenue and ROCE potential — but the valuation will only hold if execution does.
Previous coverage of SG Mart

Don’t like what you are reading? Will do better. Let us know at hi@moneymuscle.in
Don’t miss reading our Disclaimer