
Yatharth Hospital FY25 Results: PAT up 14%, Bed Capacity to Double by FY28
Guided for 30% growth with stable margins in FY26. ARPOB, oncology, and improving government & international mix —valuation leaves little room for execution miss
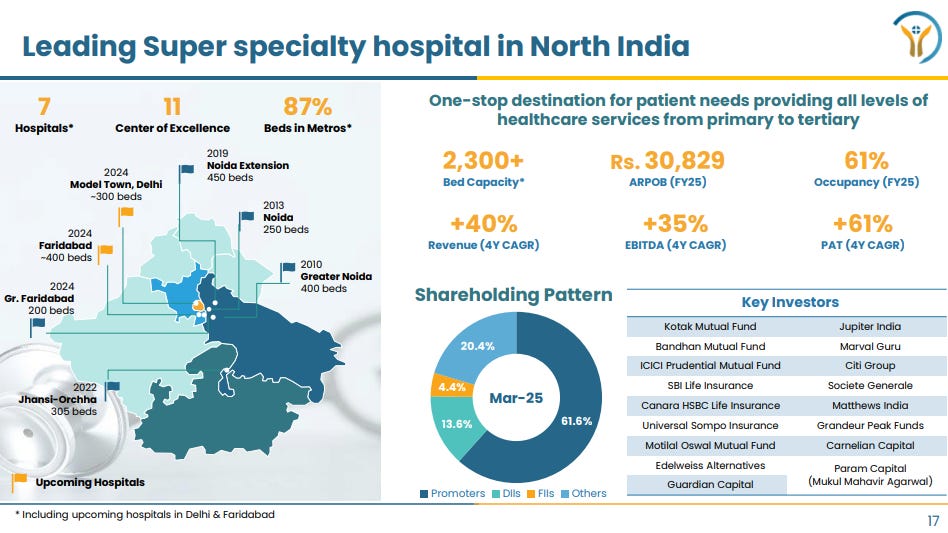
1. Super specialty hospital chain
yatharthhospitals.com | NSE: YATHARTH
2. FY21–25: PAT CAGR 60% & Revenue CAGR 38%

Revenue nearly 4x growth in 5 years; FY25 revenue at ₹880+ Cr.
PAT CAGR ~60%; strong operating leverage until FY24.
EBITDA margins stayed healthy despite new unit drag in FY25.
Cash flows rebounded sharply in FY25 (₹1,496 Cr) after FY24 working capital drag.
FY25 OCF conversion highest at 68%, showing improved collection efficiency.
2.1 What Drove FY21–25 Performance
Revenue nearly doubled and PAT grew 3x, driven by scale and operating leverage.
High-Value Case Mix: Increasing share of super-specialty services (e.g., robotics, nephrology, cardiology).
Network & Scale Gains
Hospital base expanded from 3 to 7; bed capacity from ~1,400 to ~2,300.
Outpatient volumes up ~19%, inpatient up ~34% in FY25 alone
Asset-Light Capex Cycle
Recent acquisitions and brownfield expansions completed without land cost.
Large upfront capex largely absorbed; new hospitals (Delhi, Faridabad) to ramp in FY26.
3. Q4-25: PAT up 1% & Revenue Up 30% YoY
PAT up 27% & Revenue Up 6% QoQ

Revenue and EBITDA continued strong momentum; PAT saw full recovery QoQ.
Margins declined due to ramp-up losses in Faridabad and depreciation from new infra.
Volume growth and higher ARPOB (₹31.4K) helped offset pressure.
4. FY25: PAT Up 14% & Revenue Up 31%

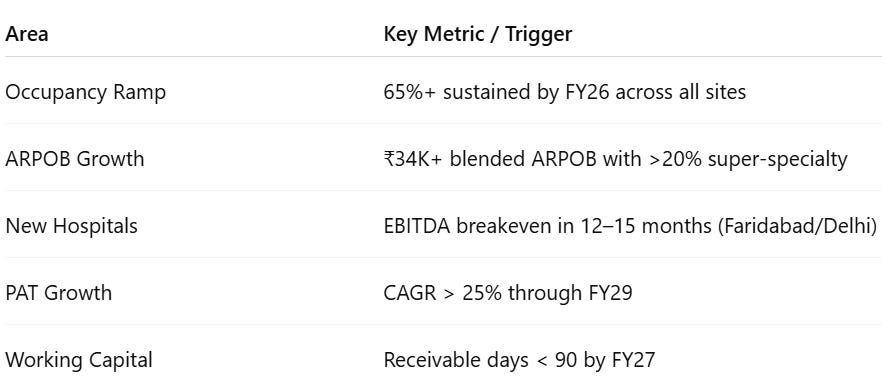
Growth led by higher occupancy (61%) and ARPOB gains (+8%).
Oncology and robotics drove case mix upgradation.
Margins diluted by losses at new units and depreciation spike.
Strong recovery in OCF positions Yatharth for next phase of capex and scale.
5. Business metrics: Temporary dip in ratios

FY25 return ratios dipped due to front-loaded capex, equity dilution, and margin compression from new hospital ramp-ups.
Management expects normalization as new units breakeven and ARPOB/margins improve.
6. Outlook: 30% Revenue Growth in FY26 with 24-25% EBITDA margins
6.1 FY-25 Expectations vs Performance — Yatharth Hospital
✅ Key Achievements
Strong Growth: Revenue rose 31% YoY to ₹8,805 mn, supported by a 34% rise in inpatient and 16% in outpatient volumes.
Cash Flow Strength: Operating cash flow stood at 68% of EBITDA, reflecting healthy collections despite high receivables.
ARPOB & Occupancy Gains:
ARPOB increased 8% YoY to ₹30,829; Noida Extension led with a +11% ARPOB rise to ₹38,033.
Group occupancy improved from 54% to 61%, with Noida Extension and Jhansi reaching ~60% and ~50%, respectively.
High-Value Services Expansion:
Oncology tripled YoY, now contributing 10% of group revenue, and 19% at Noida Extension.
Robotic surgery and PET scan capabilities were commissioned across key hospitals.
International Patient Focus (MVT):
Outreach programs launched in Nigeria, Uzbekistan, Tajikistan, and the African diaspora in India.
Strategic push aimed at boosting ARPOB via international medical value travel.
❌ Key Challenges
EBITDA Margin Compression: Fell 182 bps YoY to 25%, impacted by initial losses from new hospitals like Greater Faridabad.
Working Capital Strain:
Receivable days remained elevated at ~120, driven by ~37% institutional (government) business.
PAT Growth Lag:
PAT grew 14% YoY, trailing EBITDA growth of 22% due to a 95% surge in depreciation.
Q4 PAT remained flat YoY.
Noida Hospital Revenue Flat:
Despite a 10% ARPOB increase, revenue was stagnant due to a strategic cutback in low-margin institutional volumes.
6.2 Outlook for FY26 — Yatharth Hospital
1,605 beds as of FY25 end, excluding upcoming hospitals in Delhi & Faridabad to scale 2X up to ~3,000 by FY28

Revenue & Operational Growth
Management is targeting ~30% YoY revenue growth to continue in FY26.
Two new hospitals — Delhi (300 beds) and Faridabad (400 beds) — will be fully operational by Q2 FY26.
Both facilities are expected to achieve EBITDA breakeven within 12–15 months of launch.
Faridabad’s revenue expected to double, while Delhi should match Greater Faridabad’s first-year performance (~₹436 mn).
ARPOB & Margin Outlook
New hospitals are projected to begin with ARPOB ~₹35,000, higher than the FY25 average of ₹30,829, driven by:
Lower institutional mix (~20%)
Focus on high-end tertiary/quaternary care (e.g., oncology, robotics).
EBITDA margins to remain stable around 24–25%, with pressure from new unit ramp-up expected to normalize as scale builds.
Capex Plan
Committed capex of ₹300 crore annually in FY26 and FY27, allocated toward:
Ramp-up of Delhi and Faridabad hospitals
Brownfield expansions in Greater Noida and Noida Extension (200–250 beds)
Land already owned; greenfield or M&A capex to be accounted for separately.
Receivables Improvement Plan
Current receivable cycle (~120 days) is expected to improve to ~80 days in 2–3 years, as newer hospitals have lower government dependency (~20%).
Strategic Growth Levers
Regional focus remains on North India: NCR, UP, Haryana, Punjab, Rajasthan.
Continued expansion of medical value travel via focused international outreach.
Deepening of super-specialty mix (oncology, nephrology, cardiology, robotic surgery) to enhance margins and patient yield.
7. Valuation Analysis
7.1 Valuation Snapshot — Yatharth Hospital

Assumption: FY26 PAT Margin = Q4-25 PAT Margin
Sharp valuation compression expected in FY26:
PE falls from 35× → 24×
EV/EBITDA improves from 20× → ~16×
Reflects strong earnings operating leverage from new hospital ramp-up and better margin profile
Current valuation implies the market is pricing in FY26 growth expectations but not fully baking in earnings upside
7.2 What’s in the Price?
The current valuation assumes smooth execution across capacity ramp-up, margin stability, and case mix optimization:
FY25 PAT of ₹131 Cr and timely EBITDA breakeven at new Faridabad & Delhi units.
Sustained EPS CAGR of ~25–28% through FY29, implying a forward FY26 PE of ~24×.
Full hospital integration by FY27, with occupancy stabilizing around 65–70%.
Revenue of ₹1,400–1,500 Cr by FY28, led by ARPOB mix and maturity of new assets.
₹5–6 Cr PAT for every 100 beds by FY27 is implied in long-term projections.
Current stock price bakes in growth delivery — with little room for execution miss.
7.3 What’s Not in the Price?
Several upside levers remain unpriced, offering optionality:
Medical Value Travel (MVT): Patient inflow from Africa, Central Asia, and Middle East could accelerate ARPOB gains.
Higher-Than-Expected ARPOB: Faster ramp-up of tertiary services (oncology, robotics) may drive operating leverage.
Strategic M&A: Future acquisition(s) not factored into FY26/FY27 earnings.
Brownfield Expansion: Additional bed additions beyond 3,000 may unlock scale faster than modeled.
New payer segments: Corporate tie-ups, wellness programs, or partnerships with national insurers.
These drivers can re-rate the stock if earnings outpace current CAGR expectations.
7.4 Risks and What to Monitor
Key Execution and Strategic Risks:
Execution Lag: Delays in breakeven at Delhi/Faridabad or below-target occupancy can impact FY26 PAT.
Margin Compression: ARPOB stagnation or case mix dilution may pull EBITDA margin below 24%.
QIP Dilution Risk: If upcoming acquisitions underperform, ROCE may fall below 15% despite earnings growth.
Valuation Risk: At 24–25× FY26 PE, any PAT miss may cause derating back to sub-20×.
Receivable Cycles: Government billing (~37% of revenue) still impacts cash flow; slower mix shift can drag.
Geographic Concentration: NCR-heavy footprint exposes Yatharth to regional regulatory or demand shocks.
🔎 What to Monitor
⚠️ Execution must stay on track — valuation offers high reward, but low tolerance for slippage.
8. Implications for Investors
8.1 Bull, Base & Bear Scenarios — Yatharth Hospital
Bull Case (Probability =Moderate)
ARPOB exceeds ₹35K driven by faster super-specialty ramp-up;
Delhi & Faridabad breakeven in <12 months.
PAT margin sustains >17%.
ROCE expands to 24%+.
Market re-rates to 30× PE, implying strong upside.
Base Case (High)
Revenue grows at 30% CAGR;
ARPOB steady at ₹34–35K;
EBITDA margin holds 24–25%.
PAT margin stabilizes 16.7%
ROCE improves gradually to 20-22%.
Valuation remains stable at 24-25× PE
Bear Case (Moderate)
Breakeven delays at new units;
ARPOB stagnates; government mix reduction slower than expected.
PAT margin slips to <14%;
ROCE remains sub-18%.
Market de-rates to 15× PE, implying downside.
8.2 Is There Any Margin of Safety?
✅ Where There Is Margin of Safety
Business Quality & Model
Multi-specialty hospital chain with growing super-specialty mix (oncology, robotics, etc.).
FY25 EBITDA margin of 25% with strong cash conversion (68% of EBITDA).
High ARPOB visibility from premium NCR geography and increasing medical value travel (MVT).
Occupancy and patient volumes rising steadily (61% occupancy; 34% IP growth in FY25).
Capital Structure
Zero net debt; strong balance sheet post ₹625 Cr QIP.
Clean capital base allows flexibility for expansion or acquisition without near-term dilution.
₹503.2 Cr net cash position offers resilience to execution delays or working capital drag.
Execution Levers Not Fully Priced
New hospitals (Delhi & Faridabad) not yet contributing full-year PAT.
EBITDA margin expansion likely as new units scale; PAT margin of 16.7% could improve.
QIP-funded capacity + operational leverage can drive EPS by FY28 without further dilution as 3000 beds come online
Valuation compression likely: If FY28 target of 3000 bed achieved implies just 15–18× forward PE.
📉 Today’s valuation already prices in a fair bit of FY26–27 earnings, but if growth plays out, you're effectively locking in FY28 earnings of 3000 beds at a reasonable multiple.
❌ Where There Isn’t Margin of Safety
Valuation is Not Cheap
FY25 PE = 35.1×; even FY26E PE = ~24×.
Assumes near-perfect execution of capacity ramp-up, margin stability, and earnings CAGR of ~25%.
Execution Risks
Delay in breakeven for Delhi/Faridabad would drag EBITDA and PAT.
High reliance on case mix upgrade (ARPOB) and patient volume ramp-up.
37% of revenue still tied to government billing — receivables remain structurally high.
No Cushion for Disappointment
If PAT margin slips to <14% or ARPOB stagnates, EPS growth will slow, and market may de-rate to 18–20× PE.
✅ Margin of safety lies in the business model, not the stock price.
If execution holds, you're buying FY28 earnings at ~18× PE, with strong visibility on scale and margin expansion.
Previous coverage of YATHARTH

Don’t like what you are reading? Will do better. Let us know at hi@moneymuscle.in
Don’t miss reading our Disclaimer