Syrma SGS FY25 Results: PAT up 48%. Eyes 30-35% Revenue growth in FY26
30%+ revenue growth and steady margins from richer mix + exports look priced-in; at current valuations, only flawless long-term execution at current growth unlocks upside
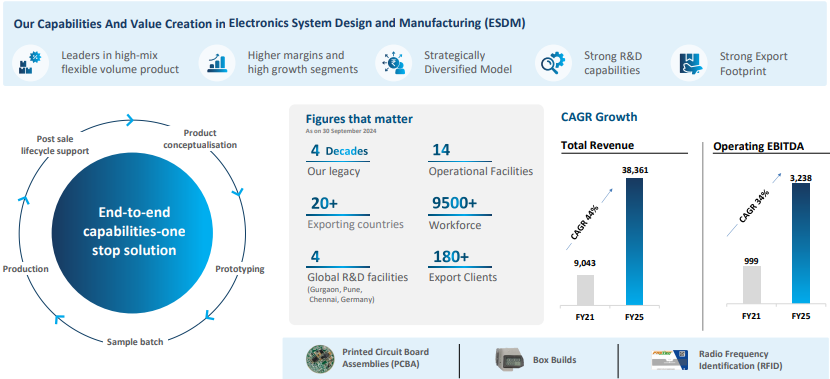
1. Electronics System Design & Manufacturing (ESDM)
syrmasgs.com | NSE: SYRMA
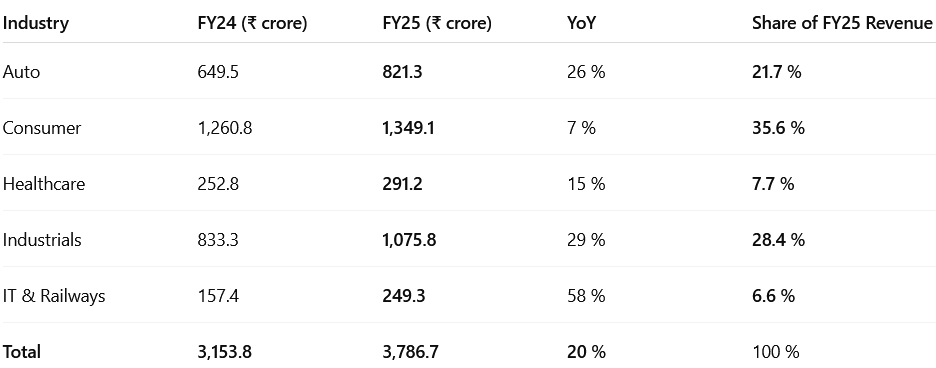
Industry-wise Revenue Break-up – FY25 (₹ crore)
2. FY21-25: PAT CAGR of 30% & Revenue CAGR of 44%
2.1 FY-25 vs. Prior Years – Key Shifts at Syrma SGS
Scale
Growth reset: FY-24 +30 %→ FY-25 +19 % as ultra-low-margin consumer volumes trimmed
Mix
Consumer share cut to ~35 % (45-50 % earlier)
Auto + Industrial >55 %; exports 23 % (EU softness)
Margins
Gross ↑ 170 bp to 22.6 %
EBITDA ↑ 160 bp to 9.7 % via richer mix, price resets, Pune efficiencies
RoCE
Rebound to 12.4 % (adj. 16 %) vs 9.9 % in FY-24; asset-turn 5.5×
Working Capital
Days 70 → 69; inventory –₹1.8 bn despite higher receivables
Capex / Capacity
Pune Phase-1 (1.2 mn sq ft) online; FY-25 capex ₹20–21 bn
Supports 6-6.5 k cr revenue without new land
Leverage
Net-debt/EBITDA steady at 0.8×
Guidance Pivot
From top-line to ≥7 % operating EBITDA focus; quality > quantity
Strategic Updates
Med-tech pipeline reset; smart-meter & industrial power wins
Consumer contracts renegotiated; Phase-2 capex planning (FY-27) underway
3. Q4-25: PAT up 58% & Revenue down 18% YoY
PAT up 34.8% & Revenue 6% QoQ
Mix Upgrade: Automotive + Industrial share >55 % (vs 45 % YoY) lifted gross margin to 27.8 %.
Overhead Leverage: New Pune & Stuttgart lines crossed 60 % utilisation, spreading fixed costs.
Working-Capital Discipline: Inventory days ↓ 33 QoQ, supporting PAT jump despite modest topline.
4. FY25: PAT up 48% & Revenue up 19% YoY
Balanced Growth: Revenue +19 % despite export softness; PAT +48 % on margin lift.
Margin Engines: Design-led industrial/auto orders, lower subcontract share, and PLI accruals drove 160 bp EBITDA gain.
Stronger Balance Sheet: Net Debt/EBITDA steady at 0.8× even after ₹200 Cr cap-ex; net-working-capital days cut to 69 (-1 YoY).
Visibility & Optionality: ₹5,300 Cr order backlog (≈16 months) + phase-II Pune capacity give 30–35 % revenue runway for FY26.
5. Business Metrics: Return Ratios Driven by Margin Re-build & Asset-turn Discipline
FY25 Take-aways
Returns rebound: ROCE +250 bps, ROE +280 bps on richer industrial/auto mix & higher Pune utilisation.
Tighter working capital: Net-WC 69 days (-1 day) frees cash, cuts equity drag.
Prudent leverage: Net-debt/EBITDA ≈ 0.8× keeps interest low; growth mostly self-funded.
Why FY23-24 Softened
Idle IPO cash / goodwill swelled capital base.
Ramp-up lag: Pune, Germany & Med-tech capacity came before revenue.
Structural Drivers (FY26-27)
Asset-turn can rise to 6.5-7× as Phase-II lines fill.
Margin tailwinds: Consumer ≤35 %, exports >25 % add ~40-60 bps EBITDA.
Cap-light growth: Design-led, high-mix wins boost profit without bloating the balance sheet.
6. Outlook: 30-35% revenue growth in FY26
6.1 FY25 Expectations vs. Performance
✅ Hits: What Worked Well in FY25
Revenue Growth and Execution
Revenue up 19% YoY — strong topline momentum amid macro softness.
Executed against a diversified order book (₹5,300 Cr+), driving industrial and auto segment expansion.
Operating Leverage Driving Margin Recovery
Consolidated EBITDA margin improved 170 bps YoY to 8.6 % (9.7 % incl. other income), aided by richer Auto/Industrial mix, component cost optimisation and scale benefits from the new Pune campus.
Segmental Outperformance
Auto (₹8,213 Mn, +26%), Industrials (₹10,758 Mn, +29%), and IT & Railways (₹2,493 Mn, +58%) grew strongly.
Industrial segment benefited from smart meters, power management units, and new export orders.
Export and Margin Focus
Export share held steady at 20–23%, with clear focus on building high-margin overseas accounts (especially in industrial and MedTech verticals).
Reduction in low-margin consumer electronics contribution from 54% (Q1) to ~31% (Q4).
Capex Efficiency
₹200 Cr capex spent without stressing leverage; net debt/EBITDA at ~0.9×.
Pune plant operationalized, providing room for 6,000–6,500 Cr revenue with existing block.
❌ Misses: What Fell Short in FY25
Consumer Segment Drag
Growth muted at +7% YoY (₹13,491 Mn), with Q2/Q3 volumes flat to down.
High-volume contracts under price renegotiation; strategy shifting to reduce mix to ~30%.
Muted Export Recovery
Export growth stalled at ~20% due to macro headwinds in Germany and parts of the EU.
FY24–25 export revenue remained nearly flat despite longer-term guidance of 25–30% export share.
MedTech Ramp Delayed
Syrma Johari MedTech contribution limited (~₹25–30 Cr in Q3), ~6% of revenue.
Management admitted delays due to customer product timelines; now expected to ramp in FY26.
Working Capital Target Miss
Working capital days remained elevated at 69 days, vs guidance to hold below 60.
Driven by onboarding of new clients and inventory build-up for new facilities
6.2 FY 26 Guidance — Syrma SGS
Strong outlook of 30-35% growth supported by sustainable margins
Revenue: As we look forward for the coming years, we are in line to grow the business at about 30%- 35% with consumer being retained at about 30%.
We have added about 20, 25 new customers in the current year,
which would go on stream this year and in FY '26, '27.
We have commissioned our Pune facility.
We have commissioned our facility in Germany, consolidating it into one location.
Margins: Sustaining the EBITDA margins of about 8% in the coming years.
Exports: We expect the exports to cross the INR1,000 crores mark. So we are delayed by a year. We should have achieved it in FY '25. We intend achieving it in FY '26.
Order book is in line with my revenue guidance. But still the overall order book is somewhere between INR5,200 crores to INR5,400 crores as of now, which is as of 31st March 2025
Working capital performance, we are currently running at around 69
days of net working capital days.
We continue to make our efforts to bring it down to below 65 days
7. Valuation Analysis
7.1 Valuation Snapshot — Syrma SGS
P / E Ratio
56.2 × (TTM) | ~ 43 × (FY26E)
EV / EBITDA
~ 32.6 × (TTM) | ~ 25 × (FY26E)
ROCE
16% (TTM) | >18% (FY26E)
¹ FY26E multiples assume 30-35 % revenue & PAT growth with an 8 %+ EBITDA margin (management guidance).
Current multiples — reflect Syrma’s FY25 delivery: 19 % revenue growth, 170 bp EBITDA-margin expansion, PAT up 48 % and ROCE back to 16 %.
Forward valuations ( look achievable if FY26 guidance (30-35 % topline, ≥ 8 % EBITDA margin) is met.
Working-capital still elevated at 69 days, but management targets < 60 days in FY26, a key lever for higher ROCE and stronger cash generation.
Re-rating triggers: export rebound past ₹1,000 Cr, Med-tech scale-up, Pune Phase-2 capacity, and steady progress toward 18-20 % ROCE by FY27.
7.2 What’s in the Price?
Execution Visibility – Street already discounts FY26 revenue growth of 30-35 % (management guidance) and ≥ 8 % EBITDA margin, supporting a forward P/E of ~43×.
PAT Trajectory Known – At current valuations the market is paying ~25× that number.
ROCE Pickup – Reported ROCE has recovered to 16 %; investors credit a glide-path toward high-teens returns by FY27.
Export Re-bound Assumed – Valuation embeds management’s target of ₹1,000 Cr+ exports in FY26 after a muted FY25.
Working-capital Caution – 69-day NWC already in numbers; gradual improvement to sub-65 days is modelled but not aggressive.
7.3 What’s Not in the Price? (Upside Triggers)
Faster Consumer-mix Reset – Should high-volume Consumer fall below 35 % of revenue sooner, consolidated margins could push > 9 %.
MedTech Ramp – Syrma-Johari design wins could scale to ₹150-200 Cr in FY26, adding high-margin, sticky revenue.
Export Beat – Stronger-than-expected EU / US demand or incremental design-led wins can lift FY26 exports well past guidance.
Pune Phase-2 Leverage – New SMT lines reaching 80 % utilisation could unlock an incremental 100-150 bp EBITDA lift without heavy capex.
Working-capital Release – Each 10-day drop in NWC frees ~₹100 Cr cash, lifting ROCE and de-levering EV/EBITDA multiple.
7.4 Risks and What to Monitor
Key Risks
EU Demand Drag – Germany remains weak; a slower export recovery could cap revenue growth and fixed-cost absorption.
Consumer-Mix Creep – Any reversal (e.g., large low-margin contract wins) would pressure blended margins.
Inventory Spike – New-programme ramps or component shortages could push NWC above the 60-day target, dampening cash flow.
Execution Slip at Pune – Delay in Phase-2 commissioning could postpone the next leg of operating leverage.
Currency / Tariff Uncertainty – Fresh trade actions on electronics could alter relative cost structures for export orders.
What to Monitor
Quarterly export run-rate vs. the ₹1,000 Cr FY26 goal.
MedTech design conversions and regulatory approvals.
Trend in NWC days – pathway from 69 → <65.
Utilisation of Pune & new North facilities (line-wise capacity).
EBITDA mix – share of Industrials, Auto & MedTech vis-à-vis Consumer.
These items will largely dictate whether Syrma defends its premium multiples—or earns further re-rating toward the targeted 18-20 % ROCE by FY27.
8. Implications for Investors
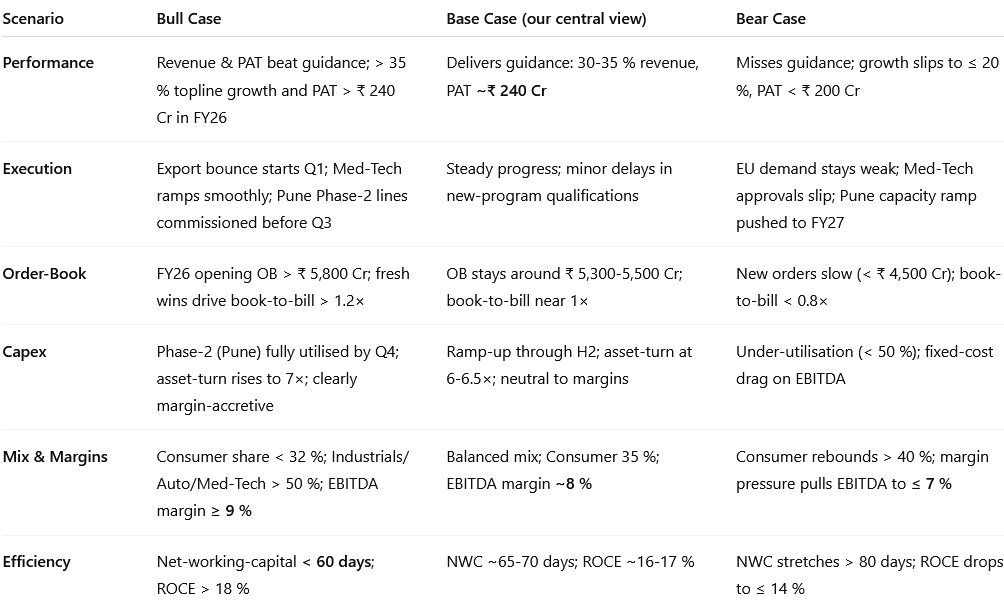
8.1 Bull, Base & Bear-Case Scenarios — Syrma SGS
8.2 Overall Margin of Safety: Low-to-Moderate
A good part of FY 26 delivery is already embedded. Execution visibility (₹ 5,300 Cr order book) and a clean balance-sheet help, but valuation leaves a relatively thin cushion if growth or mix disappoints.
What the Market Has Priced-In
FY 26 Growth (30-35 %) with sustained margins backed by the existing order book and new-customer ramps at Pune/Germany.
No Net-Working-Capital Upside – street models largely assume NWC stays ~65-70 days.
Forward Multiples already discount execution: on FY 26E, leaving limited scope for a de-rating buffer.
Upside Optionality (Not in the Price)
Mix Shift: Consumer share falls below 32 %; Industrials/Auto/Health-care > 50 % –– pushes EBITDA margin toward 9 %.
Export Re-acceleration: Return to > 25 % export mix could lift gross margins 120-150 bp.
NWC Release: Dropping to sub-60 days liberates cash, boosting ROCE > 18 %.
Capex Leverage: Faster utilisation of Pune Phase-2 lines lifts asset-turns to 7 × and takes RoCE into 20 % zone.
PLI Windfall: Any incremental EMS/Component-PLI allocation would flow straight to EBITDA.
Downside Protection Factors
Order-Book Visibility: ~ 1.4× FY 25 revenue (₹ 5,300 Cr) supports 12-18 months’ execution.
Diversified End-Markets: Auto, Industrials, Rail/IT now > 65 % of OB –– mitigates a consumer slowdown.
Capital Structure: Net-debt/EBITDA ~ 0.8 ×; ₹ 347 Cr treasury offers liquidity buffer.
Integrated Capability: In-house design plus box-build lowers dependence on any one vertical.
Overall, Syrma offers execution stability but limited multiple comfort at present valuations; incremental returns hinge on visible mix improvements, working-capital discipline and a successful export rebound.
Previous Coverage of SYRMA
Don’t like what you are reading? Will do better. Let us know at hi@moneymuscle.in
Don’t miss reading our Disclaimer


Again requesting If you can give similar information on Pidilite Industries, I will be grateful to you🙏