
Syrma SGS Q1 FY26 Results: PAT up 145%. Profitability Up, Revenue Under Pressure
Revenue growth of 30-35% in FY26 with higher margin product mix. Shift away from consumer, exports & ODM driving earnings that support Syrma's premium valuation
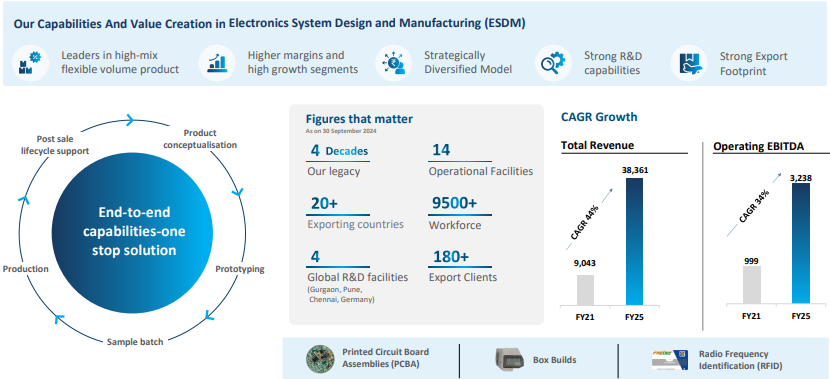
1. Electronics System Design & Manufacturing (ESDM)
syrmasgs.com | NSE: SYRMA
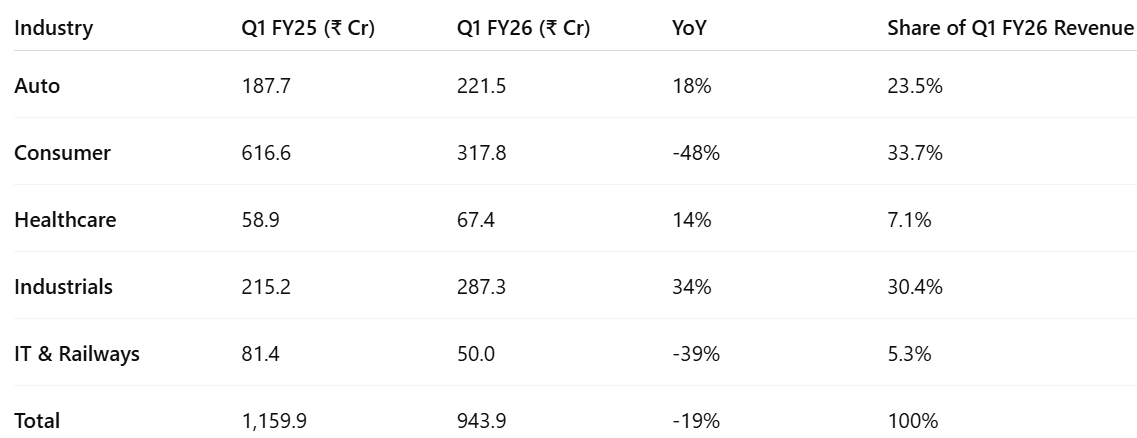
Industry-wise Revenue Break-up
2. FY21-25: PAT CAGR of 30% & Revenue CAGR of 44%
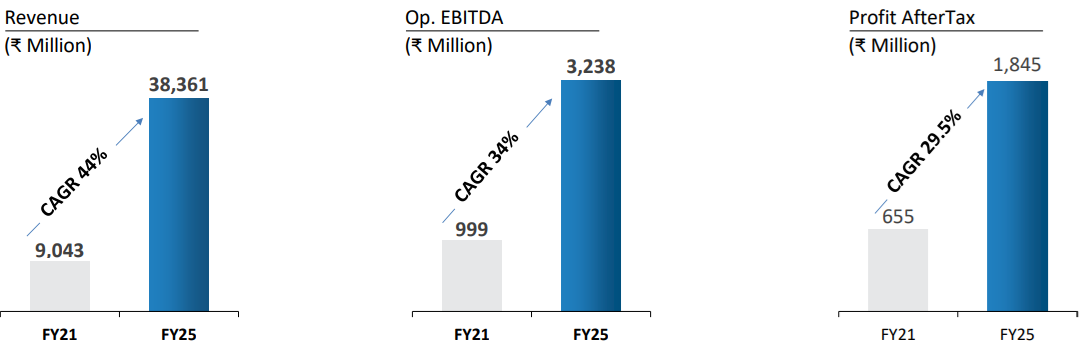
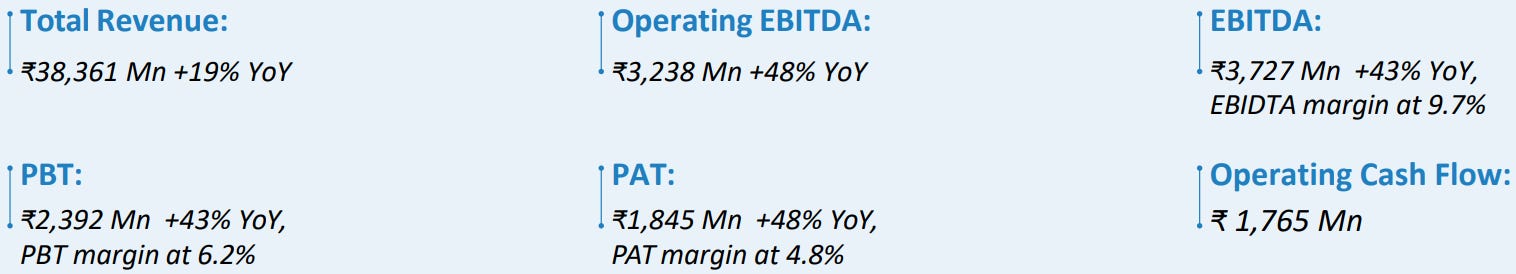
3. FY25: PAT up 48% & Revenue up 19% YoY
Visibility & Optionality: ₹5,300 Cr order backlog (≈16 months) + phase-II Pune capacity give 30–35 % revenue runway for FY26.
4. Q1-26: PAT up 145% & Revenue down 19% YoY
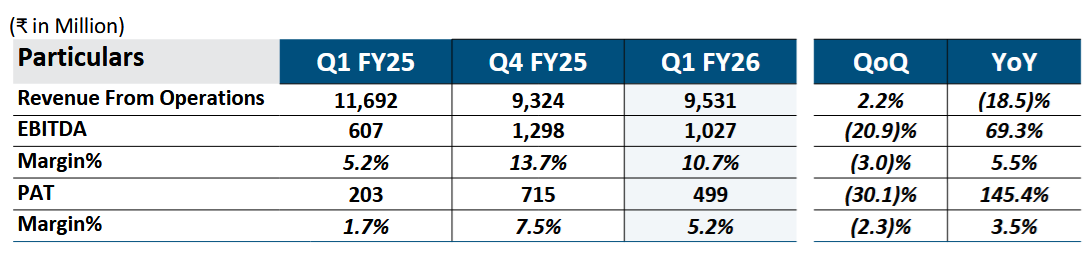
Syrma SGS Q1 FY26: Profitability Up, Revenue Under Pressure
Margin Expansion and Profit Growth
Margins Beat Guidance: EBITDA margin surged to 10.7% (vs. 8% guided), with operating EBITDA at 10.0%, driven by cost control and improved product mix.
PAT Jumped 145% YoY to ₹499 Cr, highlighting the pivot to higher-margin verticals.
Strong Growth in Focus Areas: Industrials grew 34% YoY, Auto 18% YoY — in line with the company’s high-margin focus.
Revenue Weakness and Segment Pressure
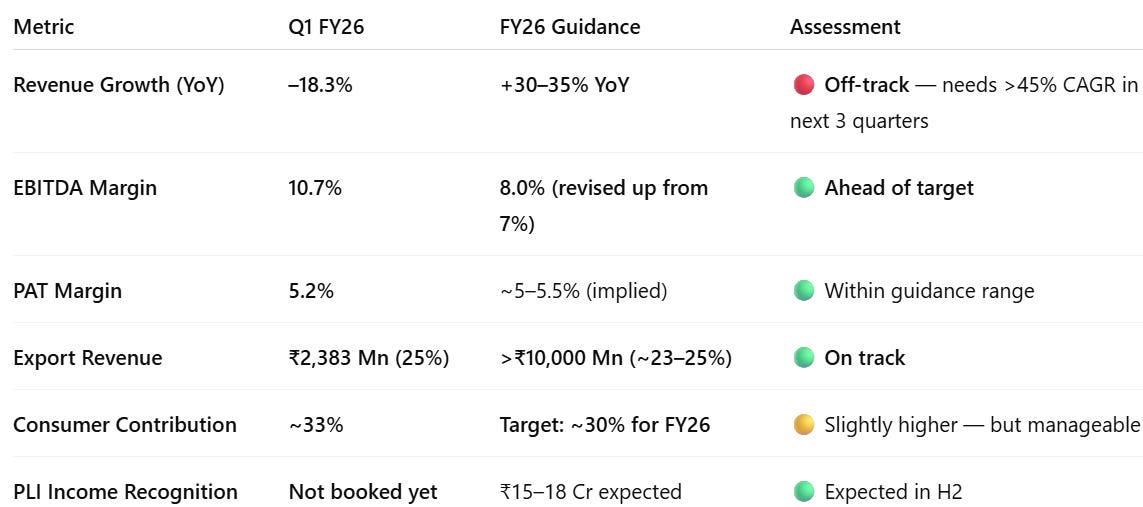
Revenue Down 19% YoY, falling short of the 30–35% annual growth target — a steep climb ahead for rest of FY26.
Consumer Segment Slumped 48% YoY, sharper than expected despite planned scale-down.
IT & Railways Revenue Dropped 39% YoY, adding top-line pressure.
Syrma SGS executed well on profitability and margin strategy. But the revenue decline, especially in Consumer and IT/Railways, challenges its ability to meet FY26 growth goals. Scaling up Industrials and Auto will be key.
5. Business Metrics: Return Ratios Driven by Margin Re-build & Asset-turn Discipline
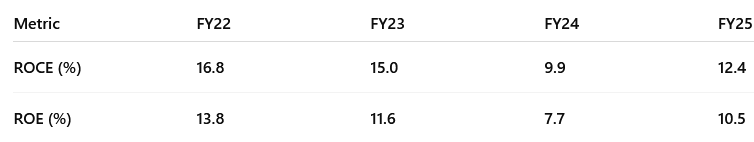
Structural Drivers (FY26-27)
Asset-turn can rise to 6.5-7× as capex comes on-line.
Margin tailwinds: Consumer ≤35 %, exports >25 % add ~40-60 bps EBITDA.
Cap-light growth: Design-led, high-mix wins boost profit without bloating the balance sheet.
6. Outlook: 30-35% revenue growth in FY26
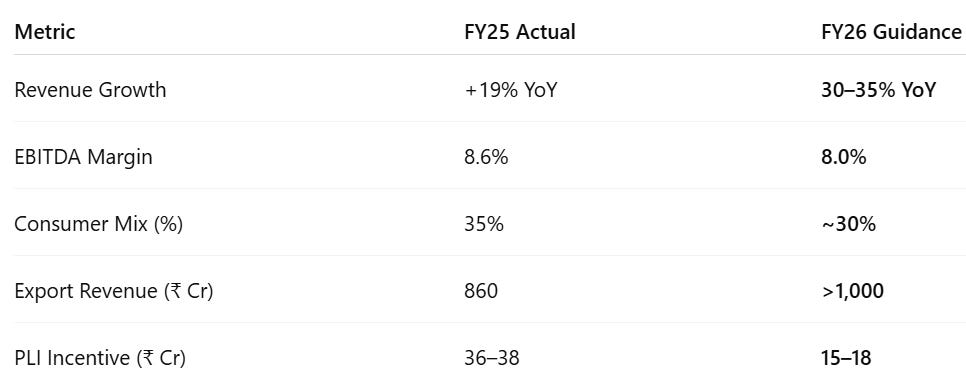
Strong outlook of 30-35% growth supported by sustainable margins
Revenue: As we look forward for the coming years, we are in line to grow the business at about 30%- 35% with consumer being retained at about 30%.
We have added about 20, 25 new customers in the current year,
which would go on stream this year and in FY '26, '27.
We have commissioned our Pune facility.
We have commissioned our facility in Germany, consolidating it into one location.
Margins: Sustaining the EBITDA margins of about 8% in the coming years.
Exports: We expect the exports to cross the INR1,000 crores mark. So we are delayed by a year. We should have achieved it in FY '25. We intend achieving it in FY '26.
Order book is in line with my revenue guidance. But still the overall order book is somewhere between INR5,200 crores to INR5,400 crores as of now, which is as of 31st March 2025
Working capital performance, we are currently running at around 69
days of net working capital days.
We continue to make our efforts to bring it down to below 65 days
7. Valuation Analysis
7.1 Valuation Snapshot — Syrma SGS
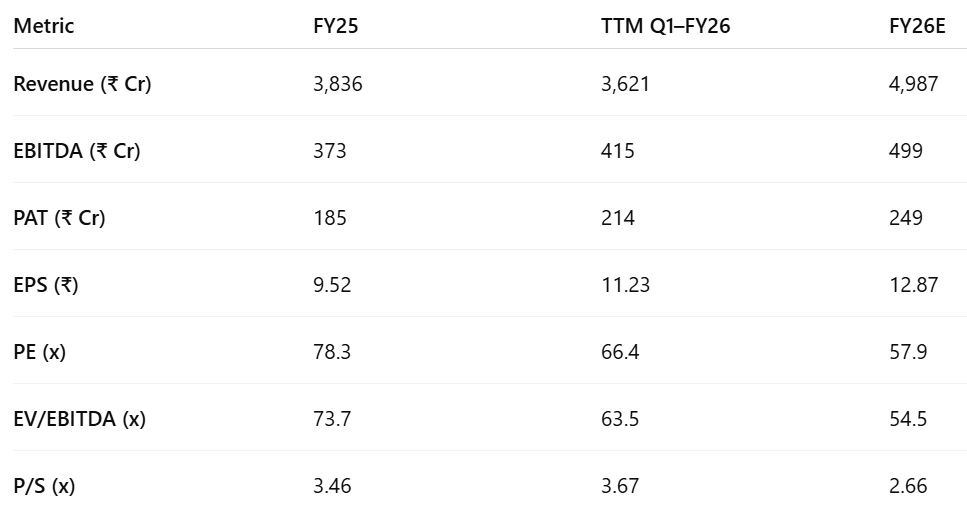
Valuation Improving Despite Growth
PE ratio is compressing from 78.3x (FY25) to 57.9x (FY26E), driven by earnings growth, not price fall — indicating valuation is getting more reasonable as profitability scales.
EV/EBITDA also follows the same path, compressing from 73.7x → 54.5x, reflecting operational leverage and margin expansion.
Operational Efficiency Boosting Valuation
EBITDA margin improves from 9.7% to 11.45% (TTM) and is expected to settle around 10% in FY26E — validating the company’s pivot to higher-margin industrial, automotive, and ODM businesses.
PAT margin and EPS are on a consistent upward trend, improving investor confidence in earnings quality.
Valuation Still Rich
Even with improvement, FY26E EV/EBITDA of 54.5x and PE of 57.9x remain elevated versus peers in EMS and contract manufacturing — reflecting:
High growth expectations
ODM-led export premium
Market confidence in scalability and execution
Syrma SGS is in the early stages of operating leverage and product mix transformation, and valuations — while still rich — are normalizing as earnings and cash flows catch up.
If FY26 execution (especially on revenue ramp-up and export momentum) is strong, current valuations can hold or even compress further without a price correction.
Investors appear to be pricing in FY27–28 growth, making execution in H2 FY26 critical for further re-rating.
7.2 Opportunity at Current Valuation
Growth Visibility
Syrma expects 30–35% revenue CAGR over FY25–26, led by:
Scale-up in Industrial and Auto segments with strong visibility.
Export growth via large-format box builds, new client wins, and recovery in Europe/US.
Greater focus on ODM and precision manufacturing to deepen customer integration.
Export share expected to cross ₹1,000 Cr in FY26 (up from ₹860 Cr in FY25), with meaningful upside potential as global accounts scale further.
Strategic Execution
Business pivot underway: Consumer share reduced from 54% (Q1 FY25) to ~33% (Q1 FY26), replaced by high-margin verticals.
Inventory down 18% YoY; working capital steady at 69 days despite export expansion.
Global Optionality
Exports contributed 25% of Q1 FY26 revenue, supported by new and existing global anchor clients.
H2 expected to benefit from EU rebound and full-year contribution from FY25 client wins.
Syrma’s strength in high-compliance, high-mix electronics positions it well with global OEMs.
Margin Expansion
Q1 EBITDA margin at 10.7%, above 8% guidance, driven by mix shift and scale.
PAT margin rose to 5.2%, up 350 bps YoY.
Key levers: ODM scale-up, exit from low-value consumer builds, and backward integration.
Structure in place for 100–150 bps EBITDA margin expansion by FY27.
Backward Integration & ODM Flywheel
ODM now ~12% of revenue, with target to reach 25% in 2–3 years.
Planned PLI-backed component investments to drive vertical integration.
This enables better control, customer stickiness, and margin expansion.
Valuation Comfort
Trades at 58.1x FY26E EPS and 54.5x EV/EBITDA, down from FY25 levels (78x/73x) due to earnings growth.
~35% PAT growth supports premium valuation.
Though rich vs peers, valuation is supported by:
Expanding margins
Export momentum
ODM execution
Integration-led efficiencies
Syrma combines EMS scalability with high-margin ODM transition. Its premium multiple reflects a credible path to long-term value creation.
7.3 Risks at Current Valuation
Valuation Leaves Limited Room for Error
Premium Multiples: Syrma trades at 58.1x FY26E EPS and 54.5x EV/EBITDA, reflecting expectations of strong revenue growth, margin expansion, and execution of ODM and export scale-up.
High Embedded Expectations: These valuations assume successful scale-up in exports, full ramp-up of new anchor clients, and realization of benefits from backward integration.
Execution Delays or Misses — such as weaker order inflows, client-specific volume declines, or delayed commissioning of new lines — could cap near-term upside and trigger a valuation correction.
Execution Bottlenecks
Multi-Segment Execution Complexity: Simultaneous scale-up in auto, industrial, ODM, and export orders — all requiring new client onboarding, capex, and integration — increases execution risk.
New JV or Capacity Delays: Component manufacturing plans under evaluation (e.g., PCBs, connectors) could face partner alignment, approvals, or cost overruns, delaying monetization.
Export Ramp Risk: While FY26 export guidance of ₹1,000 Cr is achievable, ramp-up is back-ended. Any softness in EU/US demand, or slower traction from newly onboarded customers, could affect topline visibility.
Margin Profile Risks
Component Price Volatility: As Syrma scales ODM and in-house integration, fluctuation in key input costs (semiconductors, passives, specialty components) could affect margins if not passed through to clients.
Product Mix Sensitivity: A sharper-than-expected increase in low-value builds or slower mix improvement could lead to temporary margin compression, especially post-PLI benefit tapering.
ODM Scale Dependence: Expansion in ODM share is a key margin driver. Delays or cancellations in ODM orders would impact profitability.
Customer & Concentration Risks
Client Dependence: A few large customers in Consumer and Auto drive significant revenue. Any strategy shift, product delay, or volume reset by these clients could materially impact growth.
Limited Diversification in some end-markets could intensify impact of sector-specific slowdowns (e.g., EV demand, utility metering).
Working Capital Discipline Required
Receivables Rising: Trade receivables rose 59% YoY in FY25. Further expansion in exports or government-linked verticals could stress collections and raise working capital intensity.
Execution vs Liquidity: Capex plans, if front-loaded (PLI or otherwise), may tighten free cash flows — especially if new client conversion or volume ramp is delayed.
Inventory Risks Re-Emerging: Despite FY25 reduction, any surge in input stocking (especially for custom components) could weigh on ROCE.
Policy & Regulatory Sensitivity
PLI Phase-Out: FY25 margins were partially supported by PLI (~₹36–38 Cr). With FY26 guidance lower (₹15–18 Cr), further tapering or exclusion from future tranches could pressure margins.
JV & Manufacturing Clearances: Regulatory delays (esp. for foreign JVs or new component facilities) could push monetization timelines, limiting near-term operating leverage.
Government Scheme Dependence: Any reversal or tightening of "Make in India" incentives could affect Syrma’s competitiveness in capital-intensive segments.
While Syrma is executing well on its high-margin pivot, premium valuation assumes continued delivery across exports, ODM, and integration. Risks around execution timing, working capital stretch, input cost fluctuations, and customer concentration could cap re-rating in the near term.
Previous Coverage of SYRMA

Don’t like what you are reading? Will do better. Let us know at hi@moneymuscle.in
Don’t miss reading our Disclaimer
Hello sir, I just started reading the Syrma's Annual Report of FY 24 and 23, in the Consolidated Statement of P&L, the employee benefit expense in 24 annual report for FY 23 is mentioned 101, however same expense in FY 23 report is mentioned 160, I can't seem to find any NOTE regarding that, I would be glad, if you can help in this.