
Suzlon Q1 FY26 Results: PAT Up 7%, On-track FY26 Guidance
Revenue growth of 60% in FY26, backed by a record order book and strong industry tailwinds. Premium valuations require momentum to sustain through FY28 for upside
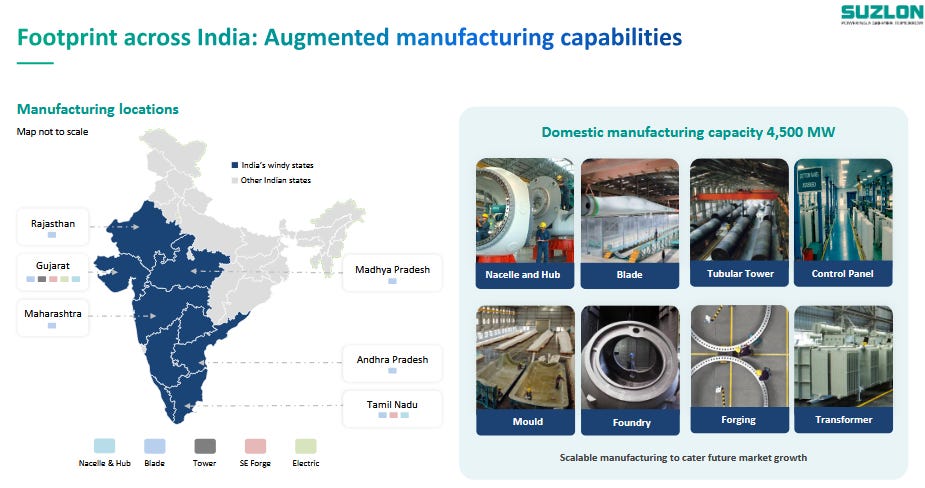
1. Wind Turbines, Operations & Maintenance Services
suzlon.com | NSE: SUZLON
2. FY21–25: Revenue CAGR of 34% & EBITDA CAGR of 37%
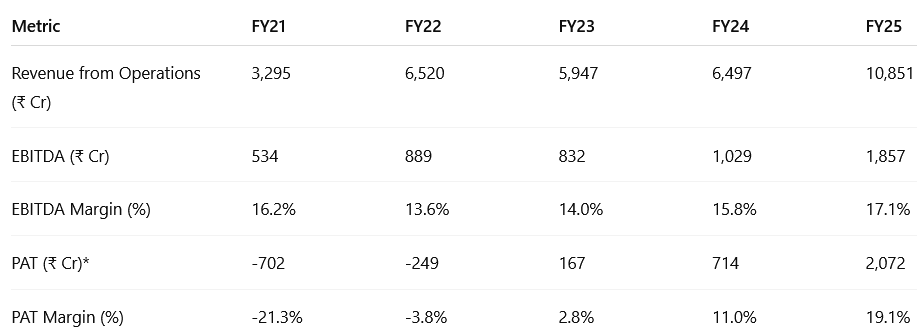
3. FY25: PAT up 190% & Revenue up 67% YoY
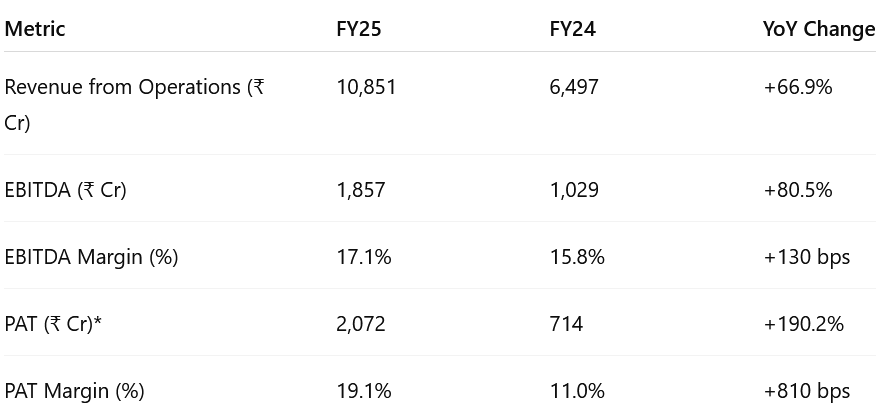
*Includes ₹638 Cr deferred tax asset gain in FY25.
4. Q1-26: PAT up 7% and Revenue up 55% YoY
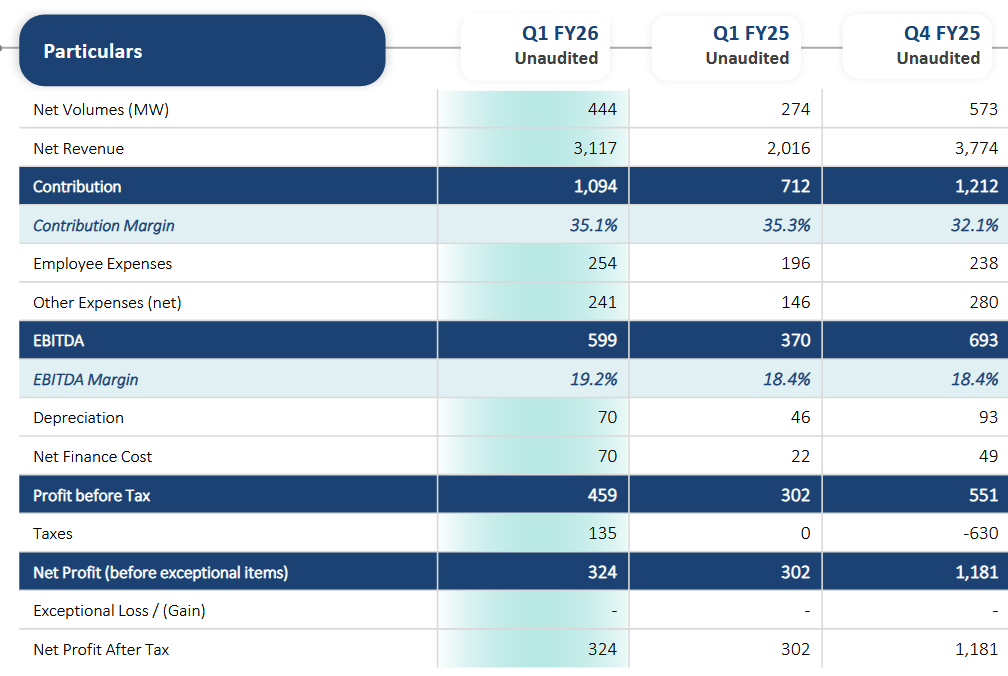
Deliveries (MW): +62% — Strong order execution in C&I & PSU segments, record Q1 volumes
Revenue: +55% — Higher MW deliveries & healthy OMS growth
PAT+7% Tax charge of ₹134 Cr (non-cash) vs near-zero last year
Segment Performance
Wind Turbine Generator (WTG)
Revenue: ₹2,495 Cr vs ₹1,497 Cr (+67% YoY)
EBITDA Contribution Margin: ~26% (vs guidance 23%) due to:
High-ASP orders delivered in Q1
Lower EPC pass-through activity (revenue lighter, margins optically higher)
Execution: 547 MW in pre-commissioning; total 664 MW delivered/erected in quarter.
Operations & Maintenance Services (OMS – India)
Revenue: ₹584 Cr (+21% YoY)
EBITDA Margin: ~39% – stable annuity-like cash flows
Base: 15.2+ GW Suzlon turbines under service (>95% availability)
Retention rate: Industry-leading; annual escalation clauses intact.
SE Forge (Foundry & Forging)
Revenue: ₹146 Cr (+59% YoY)
EBITDA Margin: ~19% (vs 11% last year) – higher utilization from domestic sourcing push (ALMM compliance).
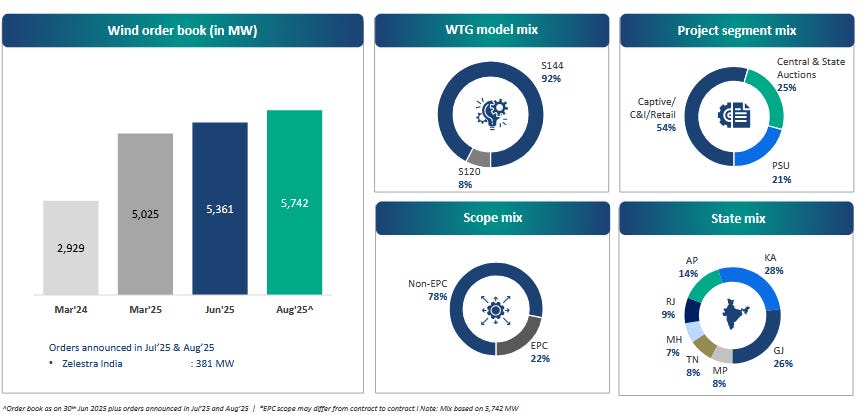
Order Book & Pipeline
Highest ever domestic Order Book of 5.7 GW and strong pipeline provide clear revenue outlook
Summary View
Q1 FY26 shows record Q1 volumes, strong double-digit revenue and EBITDA growth, and healthy margins.
The key positives are:
Order book at historic highs with diversified segment mix
S144 platform dominance (>5 GW orders)
Strengthened balance sheet and credit rating
OMS providing stable cash flow base
The main watchpoint is site readiness delays in non-EPC projects, which could cause a delivery-commissioning gap. Management’s approach to secure land in advance and maintain a capital-light model should mitigate risks.
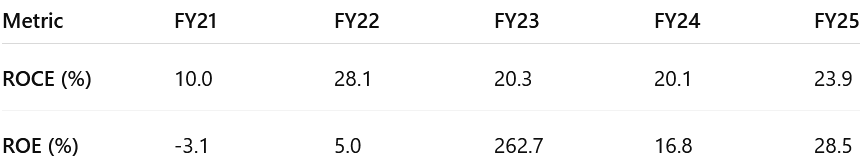
5. Business Metrics: Return Ratios Reinforced by Execution Scale and Asset Light Model
6. Strong Outlook: Revenue growth of 60% in FY26
FY26 Guidance
Growth: we're looking at about 60% growth across the parameters. So be it RR, as we call it, our deliveries, our revenue, EBITDA, normalized PAT, of course, not taking into account one-off DDA, across all these parameters, we are confident of a 60% growth in '26, over '25
EBITDA Margin: So EBITDA margin on a consol basis for the full year FY '25 has been about a little over 17%. And we would maintain that for FY '26. So we would also be around the same 17% margin for the full year FY '26.
6.2 Q1 FY26 vs FY26 Guidance – Suzlon Energy
Q1-26 Run-rate in-line to meet FY26 guidance
Positives
Order book visibility improved with more EPC projects backed by land readiness (NTPC-led) in Q1 FY26.
Higher manufacturing capacity utilization; blade plants in MP and Rajasthan fully operational.
OMS fleet and Renom’s assets under management grew, sustaining >95% availability.
SE Forge momentum from Q4 FY25 continued, with higher FY26 contribution expected.
Negatives
WTG contribution margin steady at ~23%, but higher WTG mix diluted consolidated margins.
One-off DTA benefit in Q4 FY25 absent; tax expense resumed in FY26 P&L.
Finance costs rose due to Renom consolidation, SE Forge borrowings, and higher working capital use.
Unchanged
FY26 guidance: ~60% growth in deliveries, revenue, EBITDA, and normalized PAT (ex-DTA).
EBITDA margin guidance at 17% maintained.
Strong net cash balance sheet intact.
No near-term nacelle capacity expansion; current 4.5 GW scalable to 5.5 GW.
Long-term outlook to 2030 unchanged: steady capacity growth, repowering opportunity from FY27.
Key Drivers to Watch
Execution of non-EPC orders — watch for delivery–commissioning gaps.
Order book growth — early signal for growth trajectory for FY27 & beyond
WTG contribution margin near guidance (~23%) despite likely EPC share increase in H2.
Working capital discipline during scale-up
7. Valuation Analysis – Suzlon Energy
7.1 Valuation Snapshot
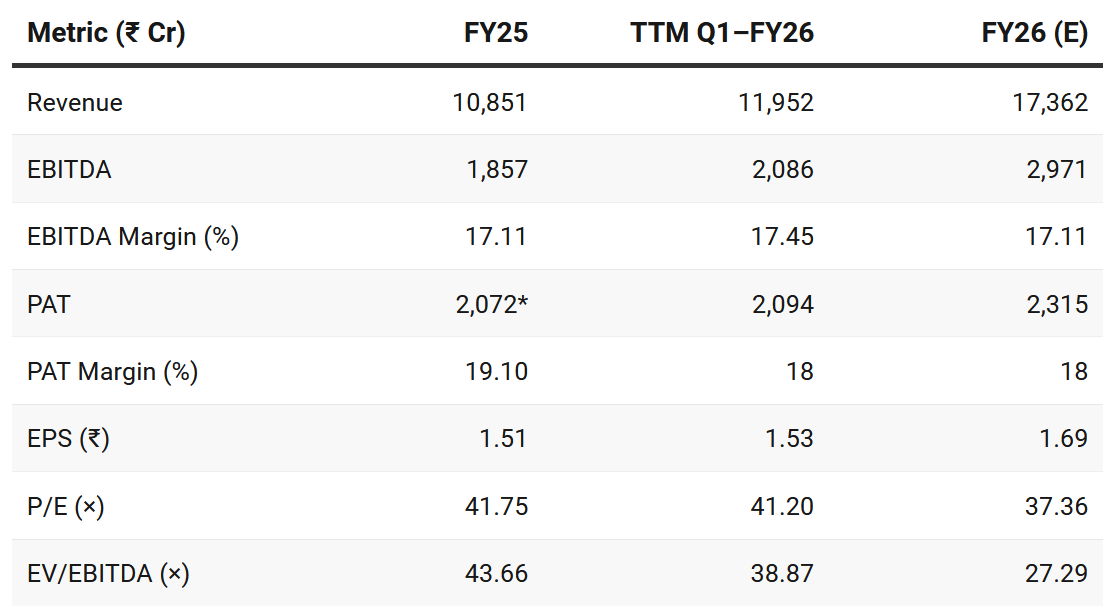
CMP ₹63.04; Mcap ₹82,703.61 Cr
FY26E P/E is calculated by assuming a 60% growth on FY25 PAT excluding DTA
P/E (×)
TTM Q1–26: 41.20× — pricing in strong growth, capital-light model, and sector leadership.
FY26E: 37.36× — moderate compression expected as earnings scale up faster than market cap growth.
EV/EBITDA (×)
TTM Q1–26: 38.87× — elevated due to growth premium.
FY26E: 27.29× — sharp compression expected on ~42% EBITDA growth in FY26E.
Summary View
Valuations are expensive for an industrial, demanding sustained growth.
If FY26 momentum fades by FY28, holding these multiples will be difficult, creating a potential entry opportunity.
Conversely, if growth extends into FY27, earnings-led valuation compression could drive upside even without a re-rating.
Growth momentum warrants close monitoring.
7.2 Opportunity at Current Valuation
Strong Order Book till FY27
Record 5.7 GW order book (>2 years’ visibility), 75% in higher-margin C&I/PSU segments, >90% S144 platform.
Scope mix (~78% non-EPC) supports capital-light scaling without stressing the balance sheet.
Executing under FY26 guidance (~60% YoY growth) should lift operating leverage and compress EV/EBITDA from ~38.9× (TTM) to ~27.3× (FY26E).
Policy & Industry Tailwinds Beyond FY27
ALMM (Wind) ensures domestic sourcing, boosting utilization.
India’s 122 GW wind target by FY32, PSU demand, and C&I shift to wind drive multi-year visibility.
25 GW repowering, hybrid/RTC tenders, and green hydrogen-linked demand sustain growth beyond FY27.
₹1,620 Cr net cash enables growth without dilution or heavy debt.
7.3 Risk at Current Valuation
Valuation Risk
Forward P/E (~37×) and EV/EBITDA (~27×) are high; any slowdown in FY27 or a miss in FY26 could trigger de-rating.
Execution Risk – High Non-EPC Mix
78% order book is non-EPC; commissioning depends on customer readiness.
547 MW in pre-commissioning at Q1 FY26-end risks delays in OMS revenue.
Margin Normalisation
Q1 WTG margin (26%) inflated by mix; FY26 guide is ~23%.
Higher EPC share or cost inflation could pressure EBITDA.
Working Capital & Cash Flow
Inventory/receivable build-up could erode ₹1,620 Cr net cash; customer delays may lengthen cash cycle.
External & Policy Risks
Grid, land, or tender delays could hit execution.
Export plans (post-FY27) face price competition, certifications, and geopolitical risks.
Previous Coverage of SUZLON

Don’t like what you are reading? Will do better. Let us know at hi@moneymuscle.in
Don’t miss reading our Disclaimer