
Suzlon FY25 Results: PAT Up 190%, Eyes 60% Growth in FY26
Backed by 5.5 GW firm orders and a growing EPC pipeline, Suzlon must deliver flawlessly—rich valuations demand execution, margin stability, and timely CODs.
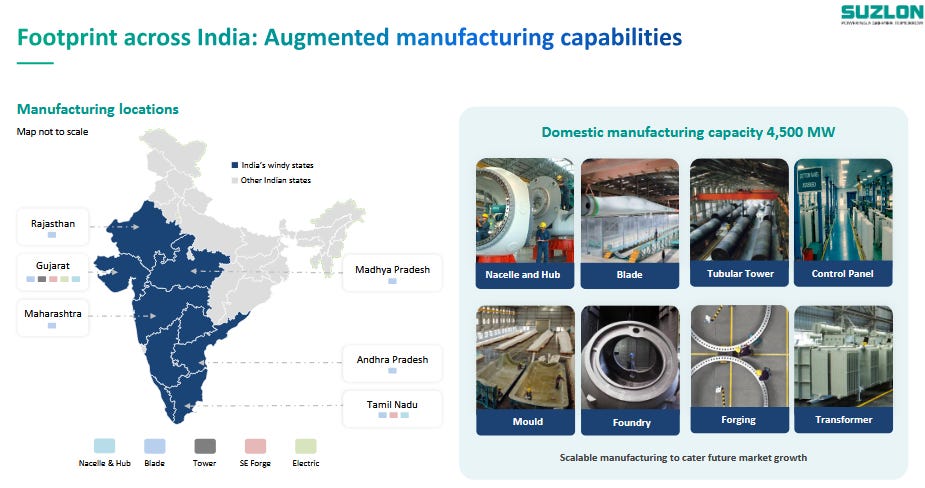
1. Wind Turbines, Operations & Maintenance Services
suzlon.com | NSE: SUZLON
2. FY21–25: Revenue CAGR of 34% & EBITDA CAGR of 37%
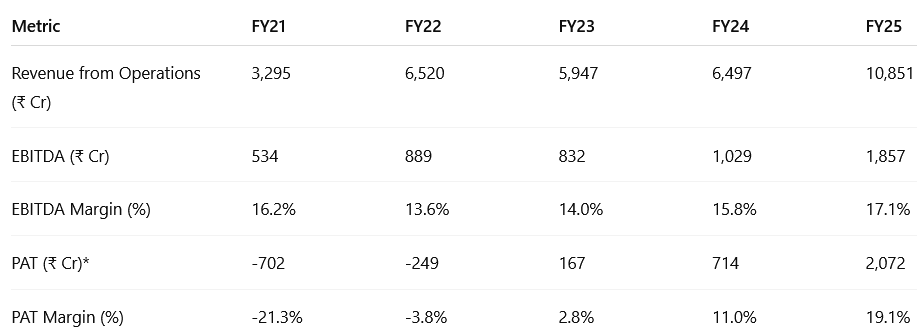
*PAT values are before exceptional items. FY25 PAT includes ₹638 Cr of deferred tax asset (DTA) recognition.
2.1 What Changed Between FY21–25
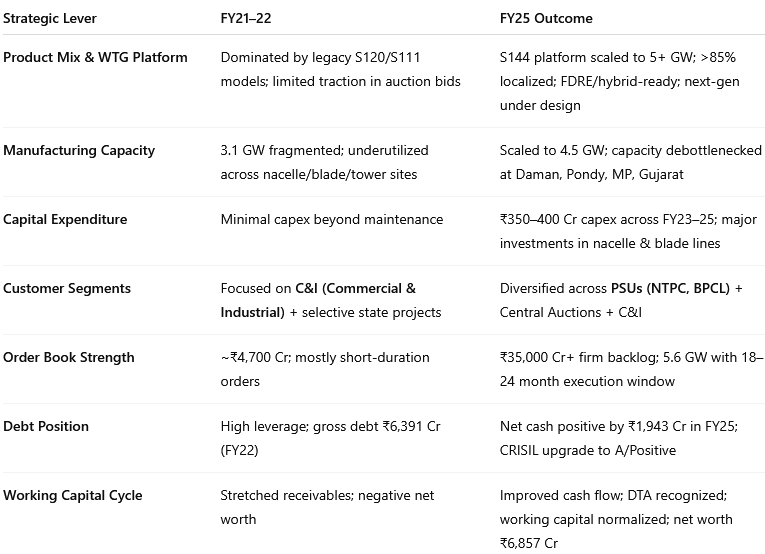
3× Revenue Growth: Scale-up across WTG, OMS, and SE Forge.
Platform Evolution: S144 matured to industrial scale with 5+ GW orders.
Capacity Ramp-Up: Expanded nacelle, blade, and tower plants to 4.5 GW capacity.
Customer Base Shift: Now includes PSU majors like NTPC, Torrent, BPCL.
Cash Conversion: ₹1,943 Cr net cash in FY25 vs ₹110 Cr in FY24; DTA recognition aids equity base.
Service Model Deepening: OMS AUM >15.1 GW (Suzlon) + 3 GW (Renom), annuity cash flows.
Export & Digital Readiness: Azure OpenAI-led digital infra; export interest from EU OEMs.
Business Model Evolution: From asset-light supplier to vertically integrated solution partner.
3. Q4 FY25: PAT up 320% & Revenue up 73% YoY
PAT up 205% and Revenue up 27% QoQ
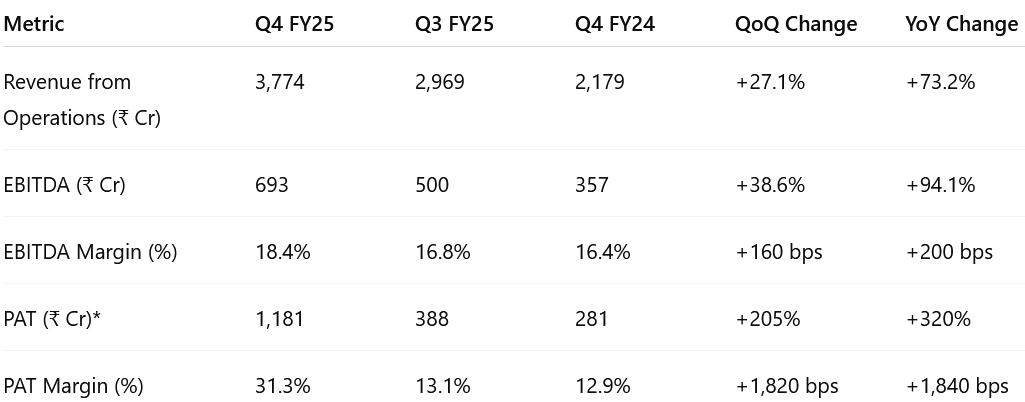
*Includes deferred tax asset recognition of ₹600 Cr in Q4 FY25.
Execution Breakout: Record quarterly deliveries (573 MW), with robust commissioning visibility across PSU and C&I orders.
Operating Leverage Playbook: Higher scale and factory utilization improved cost absorption and margin lift.
One-Time Boost: ₹600 Cr deferred tax asset recognition pushed PAT to record high—supporting equity base restoration.
Platform Dominance: S144 turbine now over 90% of order mix, driving better pricing and tech alignment for FDRE projects.
4. FY25: PAT up 190% & Revenue up 67% YoY
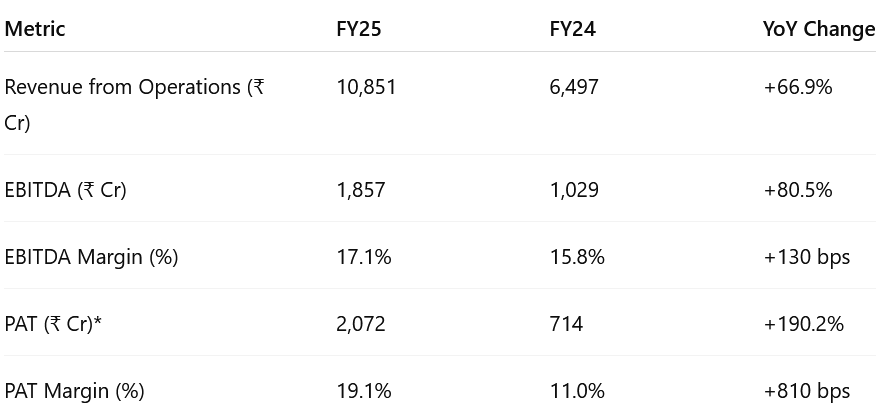
*Includes ₹638 Cr deferred tax asset gain in FY25.
Full-Cycle Growth: Revenue nearly doubled over FY23 base, underpinned by strong execution across turbines, OMS, and SE Forge.
Margin Quality Upgrade: Sustained margin expansion reflects richer product mix, pricing discipline, and fixed cost leverage.
Balance Sheet Reset: Ended FY25 with ₹1,943 Cr net cash; achieved second CRISIL rating upgrade within 12 months.
Structural Flywheel: 5.6 GW order book supports FY26–27 visibility; 4.5 GW manufacturing scale fully operationalized.
5. Business Metrics: Return Ratios Reinforced by Execution Scale and Asset Light Model
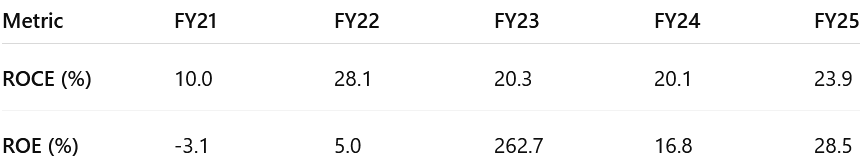
ROCE improved in FY25, driven by stronger execution, higher contribution margins, and improved working capital after full ramp-up of 4.5 GW capacity.
ROE rise, supported by ₹2,072 Cr PAT and a stronger equity base. The FY23 spike (262.7%) was a low-base anomaly; FY25 reflects normalized returns.
The FY22–25 trend signals structural gains, led by:
Margin tailwinds from product mix and cost control
Lower finance costs post-deleveraging
Operating leverage from scaled turbine output
Disciplined capital allocation and internally funded capex enabled sustained ratio expansion with a lean balance sheet.
6. Strong Outlook: Revenue growth of 60%+ in FY26
6.1 FY25 Expectations vs. Performance
✅ HITS – Suzlon FY25
Topline Acceleration: Led by WTG volumes and PSU order conversions.
Strong Margin Delivery: WTG contribution margin rose to 23.6%, beating internal guidance of ~20%; consolidated EBITDA margin held firm at 17.1%.
Normalized PAT Growth: Excluding DTA, PAT more than doubled YoY, supported by improved operating leverage and lower interest cost.
S144 Platform Dominance: 92% of order book now based on the S144 turbine, cementing Suzlon’s technology leadership in domestic wind.
Order Book Strength: Ended FY25 with 5.6 GW order book; strong replenishment expected in FY26 through PSU, C&I, and bid-based inflows.
MISSES – Suzlon FY25
Commissioning vs. Delivery Gap: While deliveries surged, (Commission on Date )COD conversion lagged due to land readiness issues on some non-EPC projects.
Contribution Mix Pressure: Higher share of lower-margin WTG in revenue mix led to marginal decline in consolidated contribution margin YoY.
6.2 FY26 Guidance – Suzlon Energy
60%+ revenue growth with stable margins in FY26
Order-book of 5.5 GW+ order book, to be executed over FY26–27
Overall Growth
Suzlon targets 60%+ growth across key metrics:
Deliveries, revenue, EBITDA, and normalized PAT (excluding DTA)
Commissioned MW growth will exceed 60%, given a lower base in FY25.
Margins
WTG (Wind Turbine Generator) Division: Contribution margin to remain at ~23% (vs 23.6% in FY25); earlier expectations of "late teens" upgraded to consistent 20%+.
O&M Division: Contribution margin in high 60s, EBITDA margin ~40%. Quarterly margin volatility may arise from insurance, VAP/VAS, or claim settlements.
Consolidated EBITDA Margin: Maintain ~17%, despite lower-margin WTG scaling faster than higher-margin O&M.
As the WTG business (with a lower contribution margin around 23%) grows faster than the O&M business (with a higher contribution margin around 68%), the consolidated contribution margin might slightly decrease in percentage terms, but the consolidated EBITDA margin is expected to be maintained.
Segmental Revenue
WTG Segment: Main growth driver in FY26.
O&M: Flat to moderate growth; relative margin shrinkage as WTG expands.
SE Forge: Uptick seen in H2 FY25; FY26 to see steady QoQ improvement. Working towards increasing utilisation by targeting non-wind sectors (railways, defence) and exports. Facility ready for 3 MW+ platform.
Order Book
FY25 ended with a record 5.5 GW+ order book, to be executed over FY26–27.
Management confident of strong order inflow momentum for the next 18–24 months.
Additional ~1.1 GW under development expected to convert into EPC orders during FY26.
Orders have price validity clauses, steel pass-throughs, and volume-based supplier contracts for cost stability.
92% of the order book is for S144, 8% for S120.
Capex
FY26 Capex: ₹400–₹450 Cr for sustenance, R&D, IT, and minor capacity upgrades.
Installed Capacity: 4.5 GW, scalable to 5.5 GW with 3-shift ops and mold additions.
No major expansion needed; capacity sufficient for FY26 targets.
Tax Outlook:
Suzlon recognised a Deferred Tax Asset (DTA) of ₹638 crores in Q4 FY25. They expect a large part of this DTA to be absorbed in FY26. A positive tax rate (P&L charge) is expected to start from Q1 FY26 itself, but there is no cash outflow for tax expected in FY26. The expected P&L tax rate is around 25%.
Execution Challenges:
FY25 delays due to land and transmission; FY26 to see improvement from Q2 onward.
Land-linked delays to drop significantly in FY26, and be nearly eliminated by FY27.
EPC focus on projects with early land readiness; ~30% of order book is non-EPC.
Strategic Outlook:
Core Focus: Timely execution of order book and scaling S144 platform.
Optional Upside: Adjacent opportunities (e.g., energy storage) under evaluation.
Dividend Possibility: Post reserve reclassification (~June–July).
7. Valuation Analysis – Suzlon Energy
7.1 Valuation Snapshot
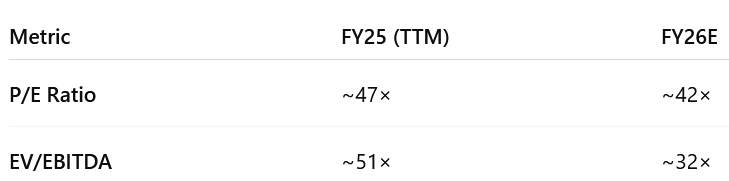
*FY26E P/E is calculated by assuming a 60% growth on FY25 PAT excluding DTA
Trailing valuations are elevated, reflecting Suzlon’s turnaround year in FY25 with record revenue, 118% growth in deliveries, and normalized PAT doubling YoY.
At current levels, valuation implies a full price for flawless execution. With Suzlon guiding for 60% growth in FY26, the stock trades at ~42× forward earnings — still rich relative to industrial peers.
Valuation rerating depends on execution certainty, especially on commissioning (COD), order-to-cash cycles, and margin maintenance. While balance sheet strength (₹1,943 Cr net cash) supports confidence, working capital pressures and project timing remain key watchpoints.
No room for multiple expansion unless FY26 outperforms guidance — both P/E and EV/EBITDA are already near upper decile of renewables/infra comparables.
Valuation compression is possible, especially if delivery execution lags or margins dip. The Street may model a derating from 47× → 35–38× as normalized PAT scales in FY26.
7.2 What’s Priced In vs. What’s Not
✅ Already Priced In:
FY26 Growth Guidance: 60% YoY growth across revenue, EBITDA, and normalized PAT — fully embedded in current ~42× forward P/E.
WTG Contribution Margins: Assumption of 23% margin in FY26 already reflected in estimates, based on strong execution in FY25 (23.6%).
S144 Platform Dominance: 92% of backlog based on S144 turbine, now viewed as default across PSU and C&I projects.
5.6 GW Order Book: Management has signaled that current backlog visibility extends comfortably into FY27 — consensus factors this in.
Balance Sheet Strength: ₹1,943 Cr net cash with no dilution risk; widely acknowledged by the market as a valuation anchor.
Self-Funded Capex: FY26 capex of ₹400–450 Cr expected to be fully funded via internal accruals — no leverage assumed.
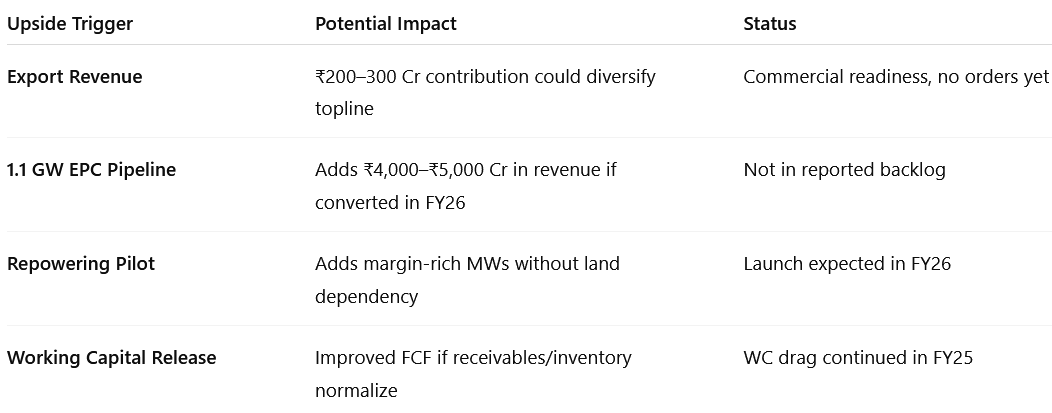
Not Fully Priced In (Optional Upside Triggers):
EPC Pipeline Conversion: ~1.1 GW of under-development projects could convert to revenue-bearing EPC orders in FY26 — not part of current backlog.
Export Ramp-Up: Commercial readiness exists; tangible export revenue (~SE Asia, OEM channels) could rerate topline quality and derisk India concentration.
Repowering Opportunity: Commercial pilot expected in FY26 with potential to scale from FY27. Not reflected in revenue models.
SE Forge Turnaround: Forging business lagged in FY25. If utilization improves with non-wind (rail/defence) orders, EBITDA uplift not yet modeled.
R&D-Led New Platform: Successor to S144 under development. A timely release could extend Suzlon’s technology edge into FY27+.
Working Capital Optimization: Receivable reduction and tighter inventory control could unlock FCF and improve return metrics.
Dividend Payout: Expected post reserve reclassification (June–July); could attract long-only investors seeking yield.
7.3 What Would Justify the Rating?
For Suzlon to sustain the forward earnings multiples, the market would need conviction on:
✅ EPC Conversion Scale-Up: Timely conversion of the development pipeline into high-margin EPC revenue streams.
✅ Export Revenue Traction: Actual revenue from overseas turbine or component sales to derisk India growth reliance.
✅ Sustained Margin Performance: WTG contribution margin of 23–24% and consolidated EBITDA margin holding ~17%.
✅ Free Cash Flow Strength: FCF growth > PAT growth through better working capital and capex efficiency.
✅ New Platform Edge: Launch or visibility on S150/S160 turbine that aligns with India's evolving wind profile.
Without this, Suzlon's valuation is likely to settle in the 30–35× forward P/E range, consistent with market leaders priced for execution but not upside surprises.
8. Implications for Investors
8.1 Bull, Base & Bear Case Scenarios – Suzlon
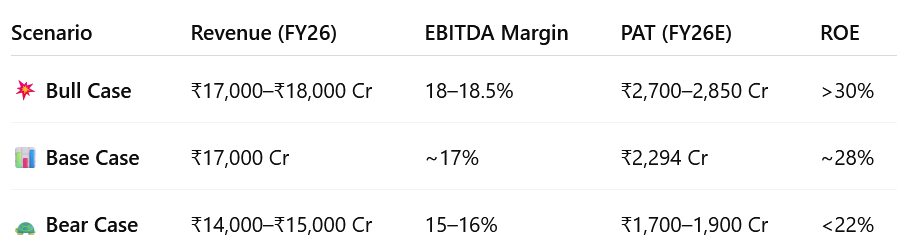
Bull Case
Deliveries exceed 2,600 MW; EPC conversion from 1.1 GW pipeline proceeds smoothly.
WTG margin expands to 24%+, driven by superior mix and execution.
Export orders contribute to revenue; early repowering revenues begin.
Working capital efficiency improves, leading to >₹2,700 Cr PAT and >30% ROE.
Base Case
FY26 guidance met: 60% revenue growth to ~₹17,000 Cr, 2,500 MW deliveries.
WTG contribution margin holds at ~23%, EBITDA margin ~17%.
No export revenue; repowering/pre-commissioning builds for FY27.
Working capital remains stable; PAT grows 60% to ~₹2,294 Cr, ROE ~28%.
Bear Case
Execution delays (especially COD), non-EPC project slippages.
SE Forge and EPC pipeline fail to convert meaningfully.
Working capital worsens due to delayed receivables and higher inventory.
Revenue slips to ₹14,000–₹15,000 Cr, EBITDA margin compresses to 15–16%, PAT growth slows to <₹2,000 Cr.
Investor Takeaway:
At a P/E of ~42×, the stock prices in a strong base case, with high confidence in execution.
Bull case (exports, repowering, EPC visibility) offers re-rating potential.
Bear case introduces de-rating risk if commissioning or cash flow falters.
8.2 Key Risks & What to Monitor – Suzlon FY26
A. Project Execution & Commissioning Bottlenecks
Land Acquisition Delays: Especially for non-EPC projects where clients are responsible. Suzlon is developing its own pipeline to mitigate this, with improvement expected in FY26 and resolution by FY27.
Transmission Constraints: Grid connectivity and evacuation infrastructure continue to limit commissioning progress.
Client Readiness: Even when turbines are delivered, client-side delays—land, substations, or civil works—hinder COD. Suzlon avoids disputes to preserve long-term relationships.
Weather & Logistics: Monsoons and logistical hurdles have caused short-term execution delays.
Supply vs Commissioning Gap: Turbines are often supplied and erected but await commissioning due to downstream bottlenecks.
B. Operational Pressures
Manpower Shortages: Sector-wide talent gaps may strain expansion.
Cost Inflation: Organisational ramp-up, capacity build-out, and R&D investments are raising short-term operating costs, even as Suzlon targets stable margins.
C. Market & Product Evolution
Lower Wind Sites: Future projects may face declining wind speeds, demanding newer turbine models with higher hub heights and larger rotors. Suzlon is already developing a next-gen platform.
Wind Variability: Year-to-year fluctuations are normal; long-term PLFs depend on robust site selection and wind data.
Competition: Growing domestic participation will pressure pricing, requiring tight cost control without margin sacrifice.
Hybrid Demand Trends: Evolving load profiles are increasing demand for custom wind-solar-storage mixes, influencing technology development and bidding strategy.
D. Margin Risk – Product Mix & Scale Efficiency
While FY25 saw strong contribution margins (23.6%), FY26 margins are sensitive to mix and cost absorption.
9. Valuation Outlook & Margin of Safety – Suzlon Energy
9.1 Where the Valuation Stands Today
At ~42× FY26E P/E and ~32× EV/EBITDA, Suzlon trades at premium multiples — pricing in flawless execution, stable margins, and full realization of its FY26 growth guidance. These levels leave little room for error.
Key assumptions embedded in current valuation:
60% YoY revenue and PAT growth in FY26
Execution of 2,500+ MW deliveries and smooth COD conversions
WTG margin stability at ~23%, consolidated EBITDA margin of ~17%
Internal accrual-funded ₹400–₹450 Cr capex, no equity dilution
S144 platform dominance across PSU and C&I orders
9.2 Where the Market Isn’t Looking Yet
These triggers could push FY26 PAT toward ₹2,500–2,600 Cr and justify a sustaining its P/E, but are not currently priced in.
9.3 Margin of Safety: Low
Despite a clean balance sheet and leadership in India’s wind OEM market, Suzlon’s margin of safety is low at current valuations. The stock prices in a strong FY26 already, and any slip in execution, margin, or cash conversion could trigger a derating.
Valuation Risk Factors:
Market expectations: Premium multiples demand PAT > ₹2,200 Cr and margin stability above 17%
Execution dependency: FY26 depends on timely EPC conversions and CODs
Supporting Positives:
S144 turbine scaled across 5.6 GW+ order book
Visibility into FY26–27 revenue through backlog
Bottom Line:
Suzlon’s stock reflects a high-confidence base case — but leaves little room for surprises. While upside exists from export scale-up or EPC conversion, downside risks lie in delayed CODs, margin compression, or cash flow leakage. At ~42× forward P/E, valuation offers limited protection if FY26 falls short.
Don’t like what you are reading? Will do better. Let us know at hi@moneymuscle.in
Don’t miss reading our Disclaimer