
South Indian Bank Q1 FY26 Results: PAT up 10%, Attractive Valuations
Retail is driving asset-side growth; focus on quality over pace. Profitability intact despite NII pressure. Book is clean. Valuations offer re-rating potential
Confused about analyzing bank stocks? Most investors get confused about NIM’s and CASA. Here’s how to actually do it right.

1. Private Sector Bank
southindianbank.com | NSE: SOUTHBANK
2. FY21-25: PAT CAGR of 114% & Net Interest Income CAGR of 10%
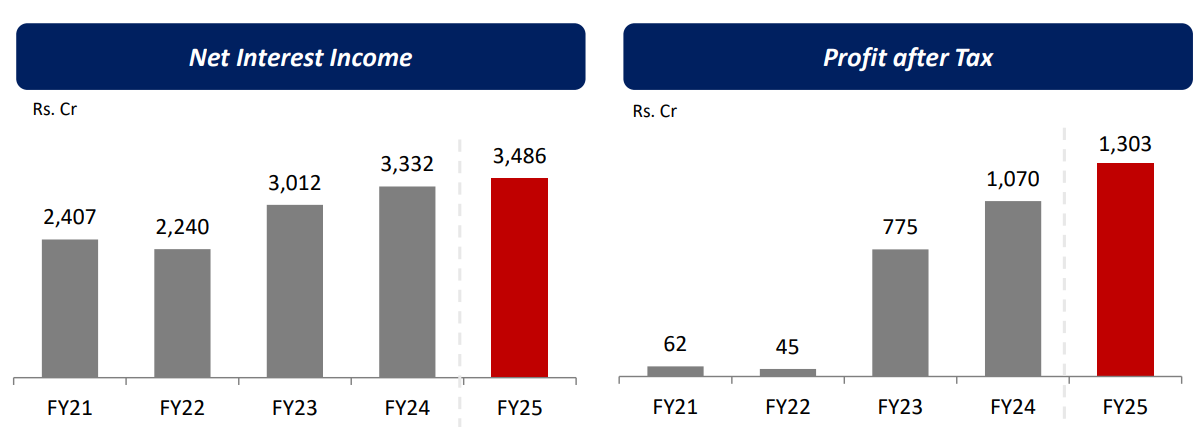
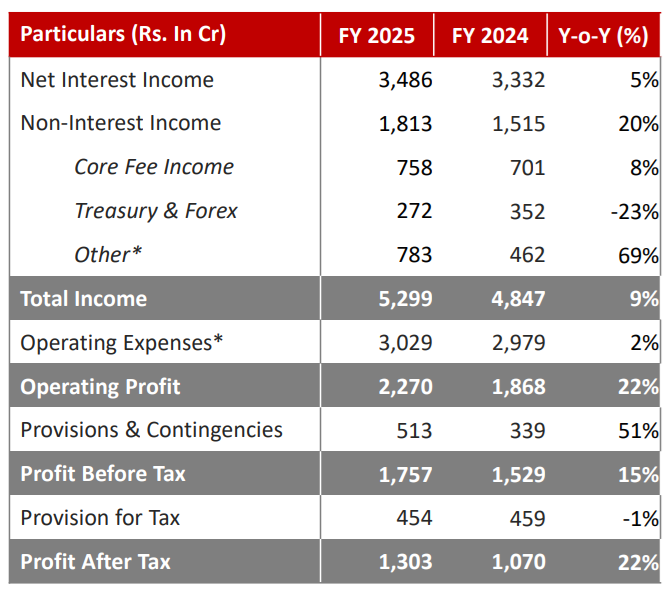
3. FY25: PAT up 22% & Net Interest Income up 5% YoY
4. Q1-26: PAT up 10% & Net Interest Income down 4% YoY
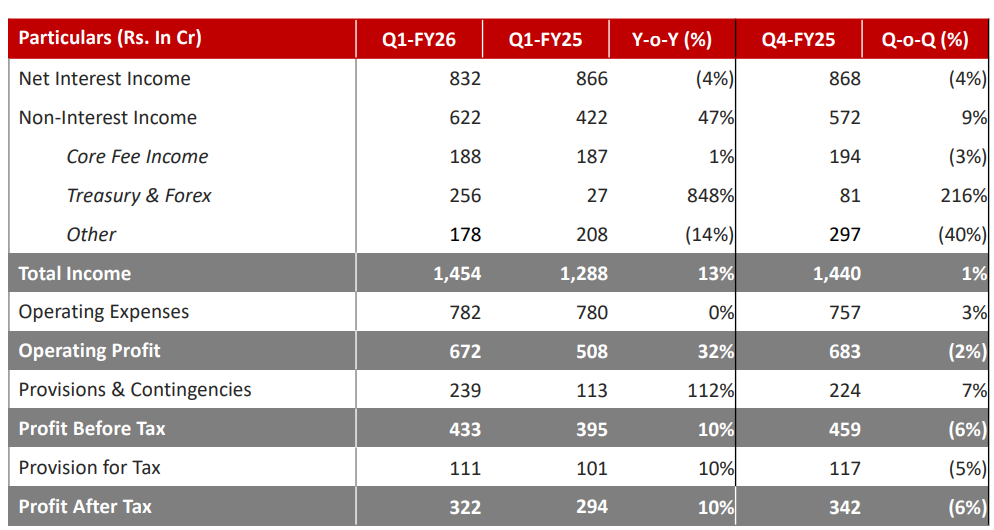
Profitability & Core Operations: Core profitability intact despite NII pressure
Net Profit rose 10% YoY despite a 4% decline in NII.
Supported by non-interest income and low slippage
NIM: 3.03% — down from 3.26% YoY due to repo-linked rate reset
Cost of funds didn’t decline in sync
Non-Interest Income: +47% YoY, boosted by ₹256 Cr treasury gains
Operating Profit up 32% YoY, driven by tight cost control and strong treasury gains (₹256 Cr).
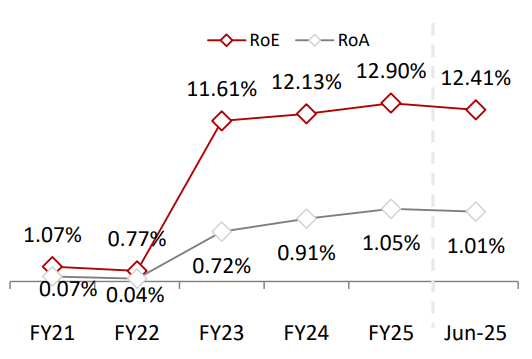
Return on Assets (RoA): Stable YoY; supported by treasury income
ROE: Slightly down due to stable PAT and growing base
Cost-to-Income Ratio: Flat YoY; expenses well-managed
Growth: Retail is driving asset-side growth; focus is on quality over pace
Advances: +8% YoY — Strong momentum in retail
Home loans +66%, Auto +27%, Gold +7%
Deposits: +9% YoY — Strong traction in current account and NR deposits
Branch Productivity (SVA): +60% YoY
Big jump in productivity, especially outside Kerala
Asset Quality: Book is clean and well-covered
Gross NPA: 3.15% (vs. 4.5%) — Sharp improvement due to legacy resolution
Net NPA: 0.68% (vs. 1.44%) — Among best in peer group
PCR (incl. write-offs): 88.82% — Conservative stance maintained
Slippage Ratio: 0.20% — Very low fresh stress addition
Credit Costs: High in Q1 — Front-loaded using treasury income; expected to taper
Capital Adequacy: Capital buffer sufficient for targeted growth; no raise required
CRAR: 19.48% — Tier 1 Capital: 18.25%
Liquidity & Funding: Granular, retail-led liabilities support growth flexibility
CASA Ratio: 32.06% — Flat YoY; CA (Current Accounts) up 21%
Loan-to-Deposit Ratio (LDR): ~79% (implied) — Balanced, allows for steady credit expansion
NR Deposits: >30% of total — Stable, low-cost source
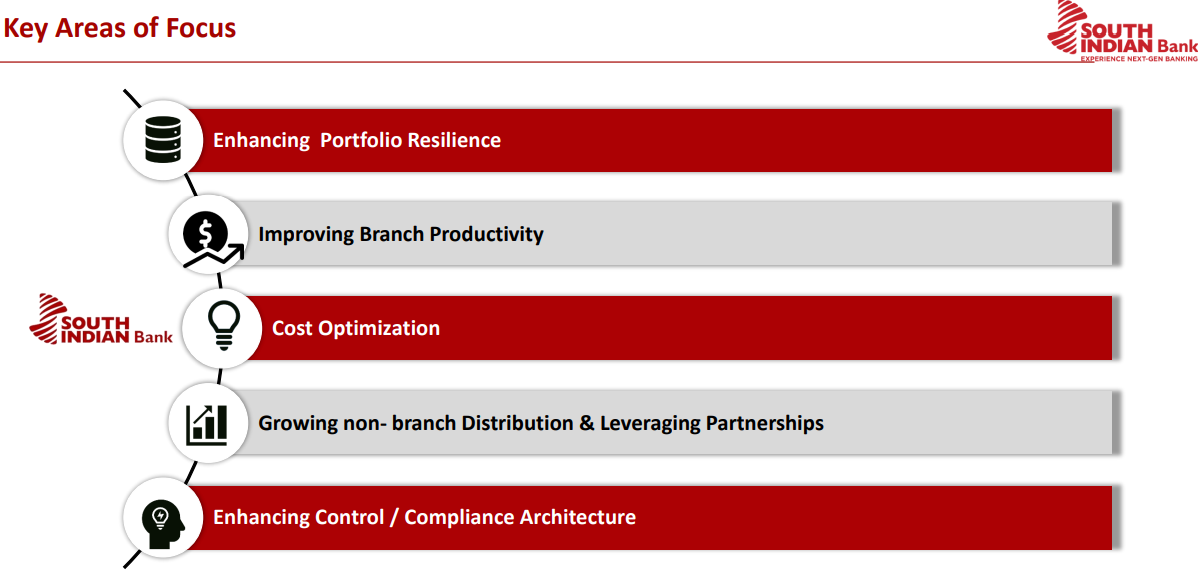
Operational Efficiency & Strategic Direction: Turnaround is digital-first, high-yield oriented, and execution-focused
Digital Infrastructure— 12+ platforms rolled out (e.g., GST Power, EduPower, Lab Power)
MSME Strategy: Geographies split between South (ex-Kerala) and Rest of India
61% of MSME book now outside Kerala
Loan Book Shift: Gradual move away from short-duration corporate loans
Focus: Retail, MSME, LAP, Gold
Execution Levers:
No new branches; sweating existing network
Hub-and-spoke underwriting model launched in key states
Summary Assessment
Profitability: Resilient
Growth: Quality-led, not volume-chasing
Asset Quality: Strongest in years
Capital: Fully adequate
Liquidity: Stable and sticky
Strategy: Executing well, aligned with ROA target
Q1 FY26 confirms structural improvement. Retail and MSME momentum is building. Margin pain remains near-term — but trajectory is right.
5. Business metrics: Improving Return ratios
6. Guidance & Strategic Outlook
Credit Growth
FY26 credit growth target: North of 12%
MSME loan book expected to grow at 15–18% in FY26.
Significant push into secured, better-yielding segments like:
Gold loans (expected to scale further)
MSME loans
LAP (Loan Against Property)
Affordable housing (early-stage efforts underway)
Deposit Growth
Expected to match or exceed credit growth.
~30% of deposits come from NRI segment, predominantly low-cost CASA.
Bank confident of continuing strong deposit mobilization without aggressive pricing.
Return on Assets:
Expecting FY26 ROA to be same as FY25 at 1.01%, increasing to 1.15% by FY27.
FY26: ROA in the 100 basis points neighborhood.
FY27: As the environment becomes a little bit more benign i.e. our cost of funding reduces in line with the repo rate cuts that have taken place the the return on assets will improve in the coming year and we think that at that point in time we'll be closer to about 115 basis points or thereabouts
Margins and NIMs
NIMs may remain under pressure in the near term due to external benchmark cuts (100 bps passed through).
Expect NIM bottoming out in Q2 FY26, with recovery beginning Q3 onwards, assuming:
No further repo rate cuts
Normalization in asset pricing pressure
Incremental growth from high-yield segments
Credit Costs & Asset Quality
Credit cost to trend lower in remaining quarters of FY26.
Q1 had elevated provisioning, funded by ₹256 Cr treasury income.
Slippages to remain <1% (20 bps in Q1, annualized ~80 bps).
Net NPA at 0.68%, no incremental aggressive provisioning expected unless unexpected events arise.
Branch Network
No near-term branch expansion.
Focus is on sweating existing branches, improving branch productivity (already up 60% YoY).
Expansion in future likely to be limited to Peninsular India, Maharashtra, Gujarat, NCR.
Operating Leverage & Cost Efficiency
Operating expenses largely flat; hiring will now increase but tied to productivity.
Aim is to maintain positive operating leverage in FY26:
Q1: Revenue up 13%, Opex flat ⇒ Operating Profit up 32%.
Medium-Term Aspirations (3-Year Horizon)
ROA Target: 1.4–1.5% by FY28 (vs 1.01% in Q1 FY26).
Will be driven by:
Higher share of MSME/retail loans
Improving yields
Cost stability and digital process efficiency
Portfolio Transformation:
Gradual exit from short-tenure, low-yield corporate book.
Rebalance into granular, higher-yield, secured retail/MSME mix.
Execution Enablers
New digital lending platforms (e.g., GST Power, LAB Power) now deployed pan-India.
Enhanced hub-and-spoke distribution model in key growth states: Karnataka, Maharashtra, Gujarat, Tamil Nadu.
Improved underwriting capacity via field-based acquisition and processing teams.
7. Valuation Analysis
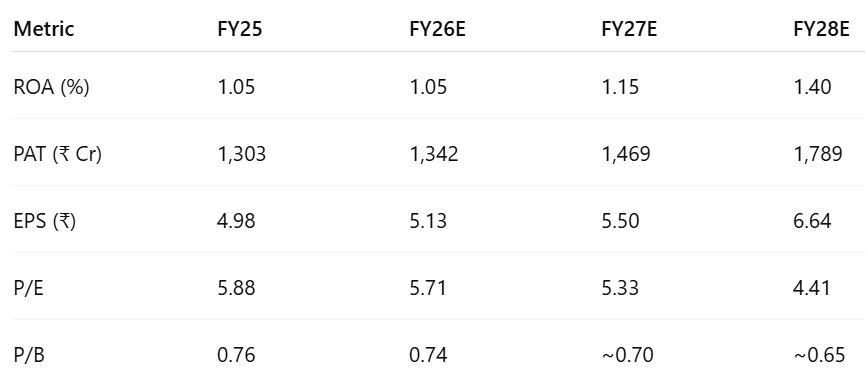
7.1 Valuation Snapshot — South India Bank
Assumptions
ROA projections are aligned with management’s forward guidance.
Asset Base is conservatively held constant at ₹1,27,770 Cr (Q1 FY26 level) through FY28 for simplicity, even though actual growth is expected. This results in a more conservative PAT estimate across forecast years.
For P/B Valuation:
Book value increases annually based on fully retained earnings; no dividend payouts are assumed.
No fresh equity issuance or dilution is factored in.
Book value excludes the impact of any asset revaluations or extraordinary adjustments.
P/E Ratio Trends (FY25 P/E = 5.88 → FY28 P/E = 4.41)
Despite growing EPS (₹4.98 → ₹6.64), the stock trades at declining P/E multiples.
Either the market isn’t pricing in growth.
Or rerating hasn’t yet occurred due to historical baggage or perceived execution risk.
P/B Ratio Trends (FY25 P/B = 0.76 → FY26 TTM = 0.74)
PAT accretion implies BVPS ≥ ₹44–46 by FY28, so implied P/B ~0.65 by FY28
Stock trades at a discount to book — market may doubt long-term RoE or franchise strength.
Typically, banks with RoE >12% sustain P/B >1.0.
Profitability + Valuation
Fundamentals Improving:
Steady ROA growth (1.05% → 1.4%)
Healthy EPS and BVPS expansion
PAT CAGR of ~11.2% (FY25–FY28)
Valuation Still Undemanding:
P/E < 6× for a RoA > 1% bank implies lack of confidence in sustainability of growth
P/B < 1.0 even by FY28 implies market isn't pricing franchise value yet
Re-rating Possible if:
South Indian Bank sustains ROA > 1.25% and RoE > 13%
MSME and high-yield retail loan traction improves
Lower credit cost and stable NIMs continue
7.2 Opportunity at Current Valuation
Consistent Profitability, But Re-rating Lagging
Track record matters: SIB has delivered consistent profitability with:
ROA > 1% for the last 6 quarters
FY25 PAT of ₹1,303 Cr; TTM PAT (Q1FY26) at ₹1,331 Cr
FY28 PAT guided to rise ~37% vs FY25, backed by stable execution and internal systems overhaul.
ROA-led PAT growth model (not credit-led):
Asset base assumed stable at ₹1,27,770 Cr, but PAT improves through yield and mix gains.
ROA guidance: 1.05% (FY26E) → 1.15% (FY27E) → 1.4% (FY28E)
Valuation Inexpensive Despite Track Record
Despite improving profitability and ROA > 1%, South Indian Bank trades at:
5.7x FY26E P/E
0.74x TTM P/BV
Earnings yield ~17%+ – undervalued vs cost of capital or PSU/old private peers
At these levels, the market does not fully price:
Operating leverage from productivity gains
Mix shift towards higher-yield secured retail loans
Stable asset quality and capital adequacy (CAR: 19.48%, Tier-1: 18.25%)
Optionality Without Structural Rebuild
Clean-up is behind: asset quality solid (Net NPA 0.68%), provisioning healthy (PCR >88%)
Growth levers in place: tech stack, digital MSME journeys, product/process-led distribution
High CASA share from NR base (30%+ NR deposits) ensures cost of funds advantage
Upside could come from:
Momentum in MSME/gold loans
ROA approaching 1.4% by FY28
Modest re-rating in P/BV (0.7× → 1.0x) as earnings compound
7.3 Risk at Current Valuation
Execution Risk in Composition of Growth
PAT growth is modeled on ROA improvement, not balance sheet expansion:
Asset growth assumption is conservative (static at ₹1.27L Cr)
Slower credit growth could still meet PAT guidance — but it requires:
Yield improvement via mix shift (gold/MSME/LAP)
Cost control and fee income support
MSME and retail scale-up still in early innings, despite strong Q1 trends.
Valuation Isn’t Demanding — But Assumes Steady Execution
At 5.3x–5.7x forward P/E and 0.74x P/BV:
Stock is not pricing in breakout — but assumes no slip-ups either
Any drag in MSME momentum, margin compression, or system slippage could delay ROA lift
Capital Comfort Exists, but Monitoring Required
Capital levels are robust for now (Tier 1 >18%), and no dilution is expected near term
But:
Loan growth or branch scale-up may eventually need capital infusion
Any equity issuance could dilute P/B accretion, unless offset by higher ROA
South Indian Bank offers compounding-led upside with valuation comfort.
While the bank is not in breakout territory yet, it is quietly executing a ROA-driven transformation.
At current valuation, optionalities around multiple re-rating exist — without requiring heroic assumptions.
Don’t like what you are reading? Will do better. Let us know at hi@moneymuscle.in
Don’t miss reading our Disclaimer