
How to Analyse Indian Banks & NBFCs: Complete Beginner’s Guide to Valuation, Risk & Lending Models
Learn how to analyze Indian banks & NBFCs covering lending models, asset quality, capital ratios, valuation tools, and key financial metrics - simplified for beginners
Table of Contents
How Banks & NBFCs Make Money
Key Financial Metrics
Asset Quality Metrics
Capital Adequacy & Regulatory Health
Lending Models (Retail, Corporate, Gold, MFI, etc.)
Portfolio Quality & Liability Profile
Valuation Analysis
1. How Indian Banks and NBFCs Make Money (Explained for Beginners)
Before investing in a bank or an NBFC (Non-Banking Financial Company), it's important to know how these businesses actually earn money. Their business models are very different from companies that sell physical products or software.
Let’s break it down simply.
1.1 How Banks Make Money
Banks make money mainly in two ways:
A. Earning Interest on Loans
Banks collect money from customers through savings accounts and fixed deposits.
They pay interest to customers for keeping money in these accounts (usually 3–6%).
Then, they lend that money to people and businesses as loans — such as home loans, personal loans, car loans, or business loans — and charge a higher interest rate (often 8–15% or more).
The difference between what a bank earns on loans and what it pays on deposits is its profit from lending.
This is called Net Interest Income, and it's the main source of income for most banks.
B. Earning Fees and Commissions (Non-Interest Income)
Apart from lending, banks also make money by charging fees and selling financial products. For example:
ATM and account maintenance charges
Credit card annual fees and late payment charges
Currency exchange fees and international transaction charges
Commission from selling insurance or mutual funds to customers
Profit from investing in government bonds or securities
This income doesn’t depend on interest rates or loans, so it helps banks stay profitable even in tough times.
2. How NBFCs Make Money
NBFCs also give loans, just like banks, but they can’t accept money from your savings account. Instead, they borrow money from banks, mutual funds, or financial markets, and lend it to customers at higher rates.
A. Specialized Lending
NBFCs often focus on specific types of loans, like:
Vehicle loans (cars, trucks)
Gold loans
Micro loans to small businesses or low-income individuals
Housing loans to first-time buyers
They earn money by charging higher interest rates than traditional banks, especially when they serve customers in smaller cities or riskier segments.
B. Other Income Sources
NBFCs may also earn:
Processing fees on loans
Penalties on late payments
Commissions from selling insurance products
Compared to banks, NBFCs usually have fewer income sources and higher borrowing costs, so they need to manage risks more carefully.
1.3 Quick Comparison: How Banks vs NBFCs Make Money

1.4 Key Takeaway for Investors
Banks make money through a mix of lending and services. They usually have more ways to earn and more stability.
NBFCs focus mainly on lending and often operate in areas where banks are less active.
When investing, look at how diversified their income is and how much risk they take to earn those profits.
2. Key Financial Metrics – How to Evaluate a Bank or NBFC Before You Invest
When you're analyzing banks or NBFCs (Non-Banking Financial Companies) in India, a few core financial numbers can tell you a lot about how strong, profitable, and well-managed they are.
This section will simplify the most important metrics beginners must understand, whether you’re tracking growth, profitability, efficiency, or risk.
2.1 Income & Profitability Metrics
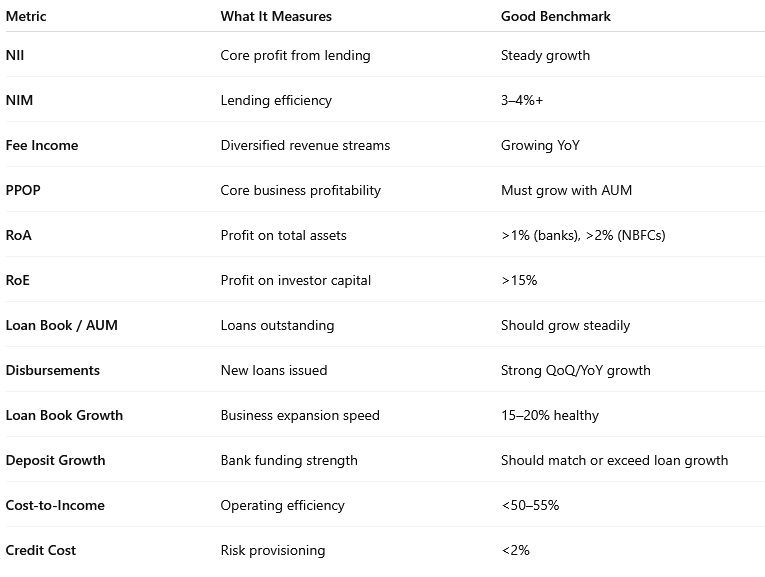
A. Net Interest Income (NII) – Core Lending Profit
What it means:
NII is the difference between the interest earned from loans and the interest paid on deposits or borrowings.
✅ A steadily rising NII shows a growing and profitable lending business.
B. Net Interest Margin (NIM) – Efficiency of Lending
What it means:
NIM shows how much profit a bank or NBFC earns for every ₹100 lent out.
✅ For banks: 3–4% is healthy
✅ For NBFCs: Often higher due to lending at higher interest rates
C. Fee Income / Non-Interest Income
What it means:
Revenue earned from non-loan activities like:
ATM & transaction fees
Credit card charges
Selling insurance or mutual funds
Forex services and more
✅ Helps diversify income beyond lending
D. Pre-Provision Operating Profit (PPOP)
What it means:
Profit before accounting for loan defaults (bad debts).
Shows core business strength, excluding risk costs.
✅ Rising PPOP = strong operating model
E. Return on Assets (RoA)
What it means:
How much net profit the lender earns for every ₹1 of total assets (loans, cash, investments).
✅ For banks: >1%
✅ For NBFCs: >2% is great due to higher-risk lending
F. Return on Equity (RoE)
What it means:
Profit made on shareholder capital. Indicates how well investor money is being used.
✅ >15% = efficient and profitable lender
2.2 Growth & Scale Metrics
A. Loan Book / AUM (Assets Under Management)
What it means:
Total outstanding loans given at a point in time.
✅ A rising loan book means business is scaling — but quality matters too.
B. Disbursements
What it means:
The value of new loans given in a specific period (quarter/year).
✅ High and consistent disbursements = strong demand and operational growth
C. Loan Book Growth
What it means:
How fast the total loan portfolio is expanding year-on-year.
✅ 15–20% YoY = Healthy growth
⚠️ >30% = Aggressive growth, check asset quality
D. Deposit Growth (Banks Only)
What it means:
The increase in total deposits (like savings accounts and FDs).
✅ Vital for banks as deposits are the cheapest source of funds
✅ Healthy deposit growth supports lending growth
2.3 Efficiency & Risk Metrics
A. Cost-to-Income Ratio
What it means:
How much the bank/NBFC spends to earn ₹1 of income.
✅ <50–55% = efficient operations
⚠️ Higher ratio may signal rising costs or falling productivity
B. Credit Cost
What it means:
The portion of income set aside for potential loan losses (bad loans).
✅ <2% is considered acceptable
✅ Summary Table: All Key Metrics at a Glance
2.4 Final Takeaway for Beginners
To evaluate a bank or NBFC:
✅ Start with NII, NIM, and Loan Book Growth to judge income and scale
✅ Check RoA, RoE, and PPOP for profitability
✅ Use Fee Income and Deposit Growth to assess diversification and sustainability
✅ Watch Credit Cost and Cost-to-Income Ratio to measure risk and efficiency
📌 Growth is good, but not at the cost of quality. The best lenders grow steadily while keeping risks low and profits high.
3. Asset Quality Metrics – How Safe Are Their Loans?
When you invest in a bank or an NBFC, you’re really investing in how safely they lend money. If too many borrowers don’t repay their loans, profits fall and the stock price can crash.
That’s why asset quality — or how healthy a lender’s loan book is — is a key metric to track.
Let’s break down the most important terms.
3.1 Gross NPA (Non-Performing Assets)
What it means:
These are loans where the borrower has not paid back interest or principal for more than 90 days.
Why it matters:
High Gross NPAs mean the company has many customers who are not repaying — a warning sign for investors.
Healthy Range:
Below 3% for strong banks
Below 4.5% for NBFCs
3.2 Net NPA (Non-Performing Assets)
What it means:
This is the % of unpaid loans after subtracting money set aside to cover them (called provisions).
Think of it like this:
Gross NPA is the total damage.
Net NPA is what’s left after first aid.
Why it matters:
Lower Net NPA means the company is well-prepared for losses.
✅ Ideal: Below 1%
3.3 Provision Coverage Ratio (PCR)
What it means:
This tells you how much of the bad loans are covered by provisions (emergency reserves set aside to absorb losses).
Formula:
Total Provisions ÷ Gross NPAs
Why it matters:
A high PCR means the lender is cautious and financially prepared.
✅ Healthy: Above 70%
3.4 Write-offs – When the Lender Gives Up on Recovery
What it means:
Sometimes, when loans are unrecoverable, banks/NBFCs write them off — removing them from books for accounting purposes.
Why it matters:
A few write-offs are normal.
Too many write-offs = weak collection systems or risky lending.
Pro tip: Compare write-offs as a % of Gross NPA over time.
3.5 Slippage Ratio – New Loans Turning Bad
What it means:
The rate at which fresh loans are becoming NPAs in a given period.
Why it matters:
A rising slippage ratio means asset quality is getting worse, even if overall NPA looks stable.
✅ Lower is better — ideally <2% annually
3.6 Recovery Rate – Getting Back What Was Lost
What it means:
This measures how much money the lender recovers from bad loans (via legal action, restructuring, settlements, etc.)
Why it matters:
Higher recovery rates mean better collection efficiency and credit discipline.
✅ Look for consistent or improving trends, especially after big write-offs.
3.7 Summary Table: How to Read Asset Quality Like an Investor

3.8 Final Takeaway for Beginners
Low NPAs and high PCR = clean, well-protected loan book
Track slippages to see early signs of stress
Too many write-offs or low recoveries may signal poor lending practices
A growing lender is good — but only if it's lending safely and getting repaid on time.
4. Capital Adequacy & Regulatory Health – Is the Lender Strong Enough to Handle Risk?
Even a profitable bank or NBFC can get into trouble if it's lending too aggressively without keeping enough of a safety buffer. That’s why capital adequacy — the lender’s ability to absorb financial shocks — is one of the most important things to check before investing.
Let’s break down the key metrics that tell you how financially secure a bank or NBFC really is.
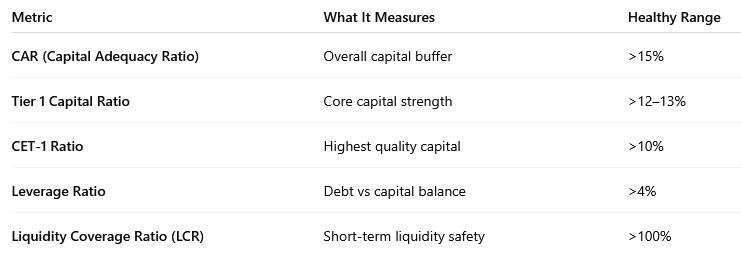
4.1 Capital Adequacy Ratio (CAR) – The Overall Safety Net
What it means:
CAR tells you how much capital a bank or NBFC has compared to the total risk it is taking through its loans and investments.
Think of it this way: If many loans go bad, CAR shows whether the company has enough funds to cover the losses and still survive.
Why it matters:
A higher CAR = stronger financial health.
The RBI sets minimum CAR levels lenders must follow.
✅ Above 15% is considered strong in India.
4.2 Tier 1 Capital Ratio – Core Strength of the Lender
What it means:
Tier 1 capital is the most stable, reliable capital — it includes equity capital and retained profits. This is the lender’s own money, not borrowed funds.
Why it matters:
The higher the Tier 1 capital, the more financially self-reliant and stable the lender is.
✅ A good benchmark is 12–13% or higher.
4.3 CET-1 Ratio (Common Equity Tier 1) – The Most Secure Capital
What it means:
CET-1 is a part of Tier 1 capital and includes only the highest quality capital — equity share capital and retained earnings. It does not include hybrid instruments like certain bonds.
Why it matters:
This is the first line of defense if the lender faces losses.
✅ A CET-1 ratio of 10% or more is considered healthy.
4.4 Leverage Ratio – Controlling Over-Borrowing
What it means:
This shows how much capital the lender has compared to its total assets, without adjusting for risk.
Why it matters:
It tells you if the lender is taking on too much debt.
The RBI requires a minimum leverage ratio (often 3–4%), but higher is safer.
4.5 Liquidity Coverage Ratio (LCR) – Can They Handle a Cash Crunch?
What it means:
This ratio measures whether the bank or NBFC has enough high-quality liquid assets (like cash or government bonds) to survive a 30-day period of severe financial stress.
Why it matters:
Even profitable lenders can fail if they run out of liquid cash during a crisis.
✅ A ratio above 100% means they’re ready to handle short-term pressure.
4.6 Who Regulates Capital & Risk?
In India, the Reserve Bank of India (RBI) is the regulator for both banks and NBFCs.
It sets rules for:
Minimum capital requirements (CAR, Tier 1, CET-1)
Lending limits
Reporting of bad loans
Risk management policies
✅ Banks face stricter rules because they handle your deposits.
⚠️ NBFCs have more relaxed norms but are catching up as RBI tightens oversight.
4.7 Summary Table: Capital Health Metrics
4.8 Final Takeaway for Beginners
A lender with strong capital ratios is like a building with a solid foundation — safe during storms.
Always check CAR, Tier 1, and CET-1 when analyzing a bank or NBFC.
Even if a stock looks cheap, avoid lenders with weak capital or poor liquidity — they may not survive tough times.
Good capital + clean loan book = safer long-term investment.
5. Lending Models – How Business Focus Shapes Growth, Risk, and Valuation
Not all banks and NBFCs lend money in the same way. Some focus on salaried individuals, some on small businesses, and others on gold or vehicles. These differences in lending models directly impact their profitability, risk levels, and long-term potential.
As an investor, understanding the lender’s core business model helps you judge:
Where growth will come from
How risky the loan book is
What kind of valuation is justified
Let’s explore the most common models.
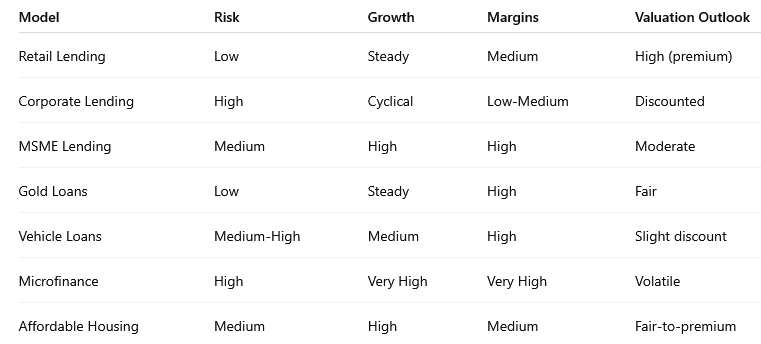
5.1 Retail Lending – Focused on Individuals
Examples: HDFC Bank, Bajaj Finance, SBI Card, Axis Bank
What They Lend:
Home loans
Personal loans
Credit cards
Two-wheeler/car loans
Consumer durables (TVs, phones, etc.)
Why It Matters for Investors:
Steady, predictable cash flows
Lower NPAs if lending to salaried individuals
High volume, low ticket size = scalable
Valuation: Often commands a premium valuation due to lower risk and consistent growth.
5.2 Corporate Lending – Lending to Big Businesses
Examples: ICICI Bank (earlier), IDFC First (legacy book), large PSU banks
What They Lend:
Infrastructure projects
Working capital loans to companies
Large industrial or construction loans
Risks:
Lumpy, high-ticket loans
Can lead to sudden spikes in bad loans if even one large account defaults
Sensitive to economic cycles
Investor Caution: Check for concentration risk (too much exposure to a few borrowers or sectors).
5.3 MSME Lending – Micro, Small & Medium Businesses
Examples: AU Small Finance Bank, Ujjivan SFB, Jana SFB
What They Lend:
Business loans to shopkeepers, small manufacturers, traders
Opportunities:
Huge underserved market in India
Higher interest rates charged = better margins
Risks:
Income volatility of borrowers
Less formal income proofs = underwriting challenges
Investor View: High-growth model, but closely track asset quality (NPAs, slippages).
5.4 Gold Loan Lending
Examples: Muthoot Finance, Manappuram Finance
What They Lend:
Short-term loans against pledged gold
Why It Works:
Fully secured loan (gold as collateral)
Quick disbursal, low cost, short-term cycle
Risks:
Gold price volatility
Rural income shocks (monsoon failures, agri income drops)
Investor View: Low NPAs, high RoE, consistent margins — but valuation may depend on gold price cycles.
5.5 Vehicle Finance
Examples: Shriram Finance, Cholamandalam Investment, M&M Financial
What They Lend:
Commercial vehicle loans (trucks, tractors)
Used vehicle loans
Two-wheeler or auto loans
Business Characteristics:
Critical for rural/transport economy
Strong used vehicle loan demand = high margins
Higher NPAs in downturns or during fuel price spikes
Valuation Insight: Priced below retail lenders due to higher perceived risk, despite strong margins.
5.6 Microfinance (MFI) Lending
Examples: CreditAccess Grameen, Spandana Sphoorty
What They Lend:
Very small loans to low-income women or self-help groups (SHGs), mostly in rural India
Why It’s Popular:
High social impact
High interest rates (~20–24%) → strong RoE
Massive untapped demand in semi-urban and rural areas
Risks:
Very high customer volumes
Political interference (loan waivers, local unrest)
Sensitive to local income shocks (crop failure, floods)
Investor Caution: Returns can be high, but risk is also elevated. Monitor collection efficiency closely.
5.7 Affordable Housing Finance (NBFCs)
Examples: Aavas Financiers, Aptus Value Housing, PNB Housing Finance
What They Lend:
Home loans to low/mid-income individuals — often first-time home buyers
Opportunity:
Government incentives (PMAY, tax breaks)
Fast-growing segment with relatively low competition from large banks
Challenges:
Informal income profiles
Documentation and title issues in Tier 2/3 cities
📌 Investor View: Steady growth, good RoA/RoE — watch for NPA trends during housing downturns.
5.8 Summary Table: Lending Models Compared
5.9 Final Takeaway for Investors
Retail lenders offer stability and consistency — ideal for conservative investors.
NBFCs focusing on MSME, gold, or vehicle loans offer higher returns, but come with higher risk.
Microfinance and affordable housing are powerful long-term stories but require close monitoring of NPAs and borrower behavior.
Before investing, always ask:
“What kind of loans does this company give — and how likely is it that those loans will be repaid?”
6. Portfolio Quality & Liability Profile – How Lenders Fund Loans and Manage Risk
Understanding how a bank or NBFC funds its lending, and the quality of its loan portfolio, is critical for long-term investors. Even a lender with high profits can face serious trouble if its liabilities are unstable or its borrowers are risky.
This section will help you evaluate:
The structure of the loan portfolio
The sources of funds (liabilities)
How these affect stability, margins, and risk
6.1 Loan Portfolio Quality – How Diversified & Secure Are the Loans?
A lender’s loan book is its biggest asset — but also its biggest risk. You want to understand not just how much it’s lending, but to whom, in which sectors, and at what risk.
A. Borrower Type Mix
Retail (individuals) → Safer, stable cash flows
Corporate (large businesses) → Risky, high impact if default
MSMEs/Self-employed → Moderate risk, depends on underwriting
Rural/Informal sector → High risk, sensitive to local shocks
✅ Investor tip: Prefer banks/NBFCs with balanced exposure across borrower types
B. Sectoral Exposure
A well-run lender diversifies across sectors — e.g., no overdependence on infra, real estate, or one industry.
High sectoral concentration = red flag in cyclical downturns
✅ Look for: Exposure spread across housing, auto, services, trade, etc.
C. Loan Tenure Mix
Short-term loans (e.g., gold, personal) → Quick cash flow but higher risk
Long-term loans (e.g., home, infra) → More stable, but need long-term funding
✅ Match between loan duration and funding duration is crucial
D. Secured vs Unsecured Loans
Secured loans (with collateral like house, gold, vehicle) = lower credit risk
Unsecured loans (like personal loans, credit cards) = higher margin but riskier
Watch for spikes in unsecured loans without adequate provisioning.
6.2 Liability Profile – How Does the Lender Raise Money?
To give loans, lenders must first raise money. Where this money comes from affects both stability and profitability.
A. CASA Ratio (Banks Only)
What it means:
CASA stands for Current Account and Savings Account deposits. These are low-cost funds, as banks usually pay just 2–4% interest.
Formula: CASA deposits ÷ total deposits
✅ Higher CASA = cheaper money to lend = better profit margins
🟢 Healthy CASA Ratio: 40% or more
B. Term Deposits (FDs)
Slightly more expensive than CASA
Still considered stable source of funds
Banks use a mix of CASA + FDs to manage funding costs.
C. Borrowings (NBFCs + some banks)
NBFCs cannot take savings account deposits. So they borrow via:
Loans from banks
Issuing Non-Convertible Debentures (NCDs)
Commercial papers (short-term bonds)
Securitization (selling loan portfolios to investors)
📌 Higher borrowing cost = lower margins
📌 During market stress, funding can dry up — a key risk for NBFCs
D. ALM (Asset Liability Mismatch)
What it means:
This checks if loan repayments and borrowings are aligned in terms of duration.
❌ If long-term loans are funded by short-term borrowings, the lender may face a cash crunch.
✅ Look for lenders with strong ALM discipline
E. Cost of Funds
What it means:
The average interest rate the lender pays to raise money.
Banks with high CASA = lower cost of funds
NBFCs usually have higher cost (7–9% or more)
📌 Lower cost of funds = better Net Interest Margins (NIM)
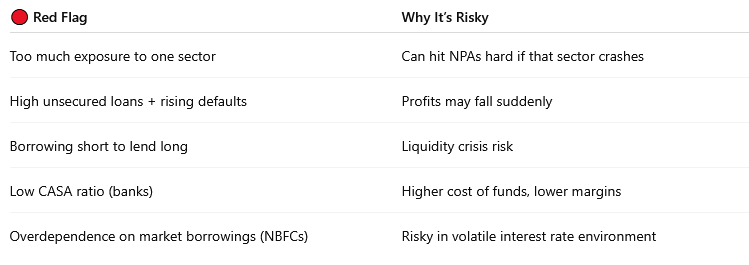
6.3 Investor Red Flags in Portfolio & Liability Mix
6.4 Summary Table: What to Track in Portfolio & Liabilities

6.5 Final Takeaway for Investors
Even a lender with strong earnings can collapse under stress if its loan book is concentrated or its liabilities are risky.
Look for banks with strong CASA ratios, diversified loan books, and clear ALM disclosures.
For NBFCs, track their borrowing mix, funding cost trends, and how well they match funding with loan durations.
📌 Remember: Not all loan books are equal. Not all money raised is safe. The best investors look beyond profits — they look at how well those profits are funded and protected.
7. Valuation Analysis – Is the Stock Fairly Priced or Overhyped?
Once you’ve evaluated the fundamentals of a bank or NBFC — its income, risk, capital strength, and portfolio — the final step is to ask:
👉 “Is the stock worth the current market price?”
Valuation helps you decide whether a stock is:
Let’s explore how to value lenders differently from other businesses.
7.1 Price-to-Book Ratio (P/B) – The Most Important Valuation Tool
What it means:
This compares the market price of a stock to its book value per share (i.e., the value of net assets the company owns per share).
Formula:
P/B = Market Price ÷ Book Value per Share
Why It Matters:
Banks and NBFCs primarily deal in assets and liabilities (loans and deposits), not products. So book value is a better anchor than earnings.
✅ Typical P/B Range:
Private Banks: 1.5x – 3.5x
High-quality NBFCs: 2x – 4x
PSU Banks or lower-growth NBFCs: <1.5x
📌 High P/B is fine only if RoE is also high and sustainable.
7.2 Price-to-Earnings Ratio (P/E) – Use with Caution
What it means:
This compares the stock price to the company’s earnings per share (EPS).
Formula:
P/E = Market Price ÷ Earnings Per Share
Why It Matters Less for Lenders:
Earnings can fluctuate due to provisions or credit cycles
Doesn’t reflect the quality of the loan book or capital strength
✅ P/E is useful only if:
Earnings are stable
NPAs are under control
Capital adequacy is strong
7.3 Return on Equity (RoE) vs P/B – The Valuation Anchor
Use this simple principle:
📌 P/B should not be much higher than RoE (long-term average)

If a stock is trading at 4x P/B but RoE is 12%, it's overpriced unless there's explosive future growth.
7.4 Adjusted Book Value – Cleaned-Up Net Worth
For lenders with bad loans (especially PSU banks), analysts often use Adjusted Book Value (ABV) instead of raw Book Value.
ABV = Book Value – Net NPAs (or provisions not yet made)
📌 This gives a more realistic picture of what the company is truly worth after absorbing expected losses.
7.5 Dividend Yield – Bonus for Long-Term Investors
What it means:
Shows how much dividend income you earn annually as a percentage of share price.
✅ Large banks like HDFC Bank, ICICI Bank, or SBI may offer 1–2% dividend yield.
While not a primary valuation tool, dividend-paying banks indicate maturity, stability, and consistent profits.
7.6 Valuation Premium vs Discount – What It Tells You

📌 A low valuation doesn't mean it's cheap. It could mean something's wrong.
7.7 Summary Table: Valuation Metrics for Banks & NBFCs

7.8 Final Takeaway for Investors
Use P/B + RoE as your primary tools for valuing lenders.
Always cross-check valuation with risk: A clean bank with steady RoE deserves a premium. A flashy NBFC with poor asset quality does not.
Don’t blindly buy the “cheapest” stock — check what the price includes and what it doesn’t.
📌 Great investing is about paying a reasonable price for quality — not buying the lowest P/E or P/B stock.