
Shakti Pumps FY25 Results: PAT Up 188%, Guides 20% Growth with Stable Margins
Shakti Pumps plans ₹5,000 cr revenue through new capacity, eyes 20 % FY26 growth; but shrinking backlog, subsidy lags & high expectations baked in trim the safety buffer
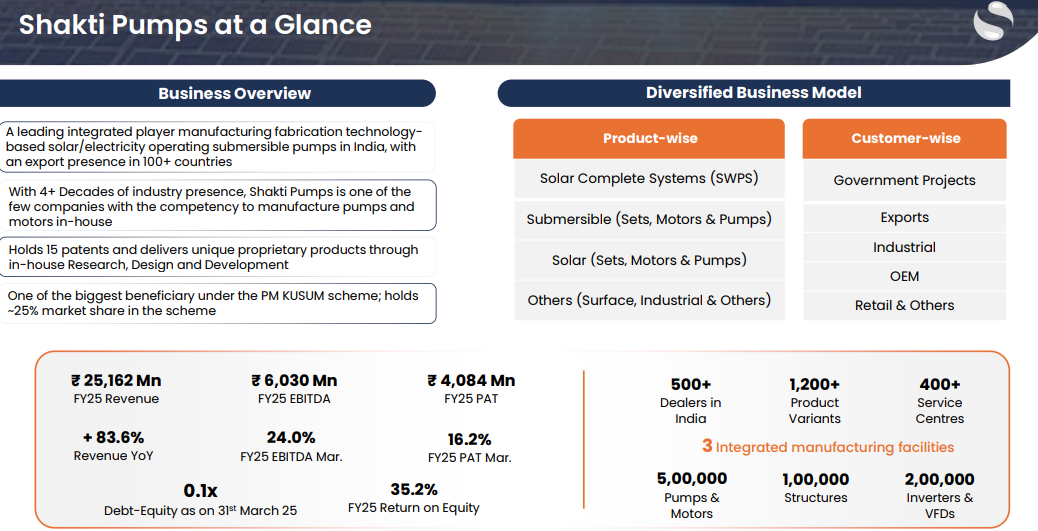
1. Manufacturing of pumps and motors
shaktipumps.com | NSE: SHAKTIPUMP
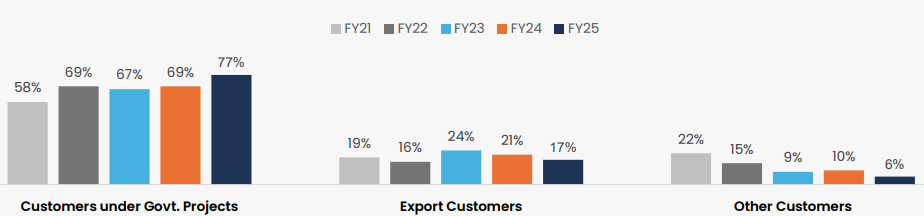
Customer Mix
2. FY21-25: PAT CAGR of 40% & Revenue CAGR of 27%

Explosive scale-up. Revenue more than doubled in two years (FY23 → FY25) as the PM-KUSUM rollout accelerated and export orders recovered.
Margin expansion. EBITDA margin swung from 6.9 % (FY23 trough) to 24 % in FY25—an 1,700 bp turnaround driven by scale, richer mix and tighter costs.
3. Q4-25: PAT up 23% & Revenue up 9% YoY
PAT up 6% & Revenue up 3% QoQ

Strong execution despite a high base: 18,749 pumps installed and ₹4.96 bn EPC revenue still drove a 9 % YoY topline bump.
Margin expansion: Maharashtra/Haryana orders and inverter-heavy mix lifted EBITDA to a record 24.6 %.
Strong Exports: Africa + US shipped ~₹1.25 bn (19 % of sales) at 10 ppt higher gross margin.
Capacity build-out finished. VFD capacity quadrupled to 4 lakh units; solar-structure capacity doubled, allowing scale without fresh debt.
Margins at cycle-highs: Sustaining 24 – 25 % EBITDA hinges on keeping the product/state mix favourable and securing panels at negotiated prices; watch raw-material spreads and subsidy pass-throughs.
4. FY-25: PAT up 188% & Revenue up 84% YoY

Cash conversion lagged. Heavy inventory build and subsidy-linked receivables meant CFO was only ₹205 mn; management targets another 30-day cut in debtors to unlock cash.
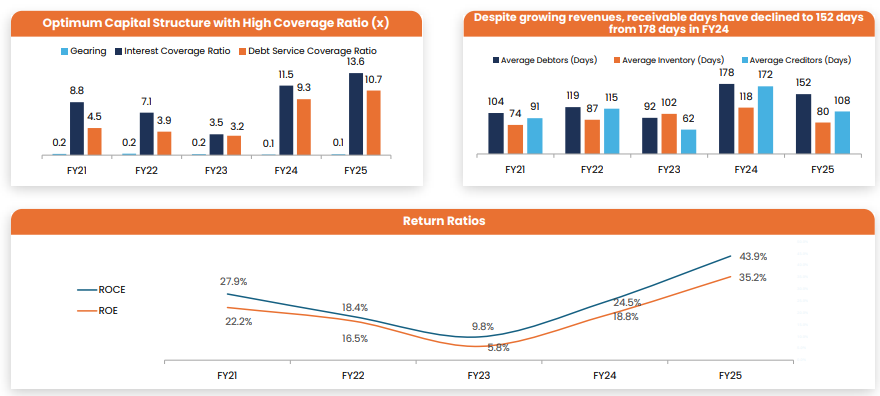
5. Business metrics: Strong & improving return ratios
Strong balance sheet: 0.1× gearing plus double-digit DSCR = balance-sheet ready for the next capacity leg without equity dilution.
Cash-funded growth keeps leverage negligible. Even with capacity-doubling cap-ex on deck, headroom is ample.
Cash discipline returning: Debtors down 26 days and inventories cut 38 days in FY25; each 10-day drop in receivables frees ~₹700 mn cash.
Subsidy processing delays sent FY24 sky-high; FY25 already 26-day better, target 120 days.
Stock build during panel-price spike unwound in FY25, freeing cash.
Still long, but shortening receivables could bring CCC < 100 days, boosting FCF.
Returns turbo-charged: ROCE climbed 34 ppt in two years, proving that FY23 was a one-off dip and that margin gains are translating straight into shareholder value.
6. Outlook: 20% revenue growth; Maintaining margins
6.1 Shakti Pumps – FY25: Expectations vs. Performance

Hits
Strong P&L Performance:
Revenue +84 % YoY | PAT +188 % | EBITDA margin jumped to 24 % vs 16.4 %
Rock-solid balance-sheet:
Gearing steady at 0.1 ×
Interest-coverage improved to 13.6 ×
Return ratios back in form:
ROCE 44 % — ROE 35 %
Export kicker:
Overseas sales ₹ 437 cr (+53 %)
Now 17 % of mix, carrying ~10 ppt richer gross margin
Capacity & execution:
~71.5 k KUSUM pumps installed
VFD capacity 4×, solar-structure capacity 2×
Misses / Watch-outs
Finance-cost creep:
Interest expense up to ₹ 44 cr (₹ 20 cr LY) on higher WC borrowings
Working-capital drag:
Debtor days still 152 (target 120); every 10-day gap locks ~₹ 70 cr cash
Cash-from-ops just ₹ 20 cr as WC soaked ₹ 460 cr
Negative free cash flow:
FCF –₹ 160 cr (₹ 180 cr capex vs ₹ 20 cr CFO)
Order-book shrinkage:
Current backlog ₹ 1,650 cr — down ~₹ 750 cr from Mar-24 peak
Continuous tender wins needed to hit FY 26 revenue guide of ₹ 3,000 cr+
Policy concentration risk:
Heavy dependence on subsidy-linked PM-KUSUM; any disbursal delay or policy change would hit volumes and cashflows.
6.2 Management Guidance – FY 26 and beyond
Revenue floor set at ₹ 3,000 cr for FY 26
~₹ 2,500 cr domestic + ₹ 500 cr exports.
Order book already covers ₹ 2,100 cr (₹ 1,650 cr domestic + ₹ 500 cr export), executable in the next 6-7 months – management is “very confident” of topping it up from Punjab, UP, Maharashtra, Rajasthan and Haryana tenders.
Profit-first stance – 24 % EBITDA margin non-negotiable
Team will chase only those states/SKUs that preserve the 24 % spread, offsetting any solar-panel cost swings.
Capacity doubled over two years
VFD line already ramped to 4 lakh units; solar-structure line to 2 lakh units.
All existing pump & motor lines slated to double, enabling a ₹ 5,000 cr revenue run-rate by FY 28 once fully sweat.
Vertical integration bet – 2 GW DCR solar-cell plant
Land allotted in Madhya Pradesh; planning phase underway to secure panels at lower cost and de-risk supply.
Working-capital sprint
Debtor days goal: 120 (vs 152 now); each 10-day cut frees ~₹ 70 cr cash, funding capex internally.
Exports to stay a growth lever
Target ₹ 500 cr in FY 26, driven by Africa & US orders that carry ~10 ppt higher gross margins.
New engines for FY 27+
EV drive-trains & rooftop solar to begin contributing; management will share separate EV metrics from the next quarter..
Management characterizes FY26 as a year of consolidation after the exponential growth of FY25,
Aiming for 20% revenue growth while maintaining EBITDA margin at 24% with ₹ 500 cr in exports.
Building the capacity to reach ₹ 5,000 cr in revenue and to maintain a ROCE in the high-20-percent range by FY 28.
7. Valuation Analysis
7.1 Valuation Summary

7.2 What the current price already discounts
FY 26 guidance as a base-case.
At ~21 × forward earnings the market assumes Shakti will in fact deliver ≥ ₹ 3,000 cr revenue, ≈ 24 % EBITDA margin and ~₹ 500 cr exports in FY 26, keeping ROE north of 30 %.Steady—but not spectacular—order replenishment.
The valuation prices in today’s ₹ 1,650 cr backlog (≈ 0.6 × sales) being routinely topped-up so that utilisation stays high, but not a step-change in order flow.Maintained cost discipline.
A low 0.1 × gearing and interest-cover above 10 × are treated as the “new normal”; investors expect working-capital needs to remain manageable at ~150 debtor days—not yet the 120-day stretch target.Pump + VFD capacity already commissioned.
The street seems to value the recently quadrupled VFD line and doubled structure line as fully productive, but assigns little incremental premium for future rounds of the same expansion.
7.3 What is not in the price (yet)
These are the swing factors that could drive a re-rating – or a de-rating – over the next 24–36 months.
The ₹ 5,000 cr revenue ambition.
If the newly announced doubling of core pump capacity and the planned 2 GW DCR solar-cell plant propel sales to ₹ 5,000 cr by FY 28, today’s 4 × price-to-sales compresses to ~2 ×, offering clear upside that is not reflected in current multiples.Vertical-integration margin kicker.
The solar-cell project could shave panel costs and add 150–200 bp to EBITDA margin, but the valuation still uses the status-quo 24 % assumption.Next-leg growth engines.
Early-stage businesses—EV drive-trains and rooftop solar—are essentially valued at zero despite management’s plan to disclose standalone metrics from FY 27.Full working-capital unwind.
Every 10-day cut in debtor days unlocks ~₹ 70 cr cash and lifts FCF; the market gives limited credit for the stated 120-day receivable goal, likely because execution proof is pending.Potential downside not fully priced:
Policy risk: any delay in PM-KUSUM subsidies could spike receivables and dent cash-flows.
Cap-ex drift: the solar-cell plant could strain leverage if cost overruns occur.
Margin slippage: a fall below 22 % EBITDA would stretch the forward P/E back into the high-20s.
The share price bakes in delivery of FY 26 targets and the recent margin reset, but leaves meaningful upside (and some unpriced risk) around execution of the ₹ 5,000 cr revenue roadmap, vertical-integration benefits, and sharper cash-flow conversion.
8. Implications for Investors: What to Watch
8.1 Bull, Base & Bear Case Scenarios
Bull (blue-sky but plausible)
Demand & orders – ₹ 3,500-4,000 cr fresh awards (vs ₹ 1,650 cr in hand) as Punjab, UP and MP issue KUSUM tenders sooner than expected.
Capacity & utilisation – Existing pump/VFD/structure lines run ≥ 80 %; incremental throughput squeezed out before the next round of cap-ex is commissioned.
Pricing / mix – Higher-margin states (Maharashtra, Haryana) dominate; inverter + structure content creeps to 35 % of revenue (31 % FY-25).
EBITDA margin – 25 % (extra 100 bp vs FY-25) from product mix (+50 bp) and first savings on solar-cell backward integration (+50 bp). Working capital – Debtor days compress to ≈ 120 as states clear subsidies faster; inventory normalises at 75 days; CCC < 90 days → CFO ≈ 80 % of EBITDA.
Cap-ex / leverage – Cell-plant breaks ground H2 FY-26; funded 70 % internal accruals / 30 % debt, keeping gearing ≤ 0.25 ×.
Macro / policy – No major subsidy delays; INR stable; panel prices flat.
Base (best-judgement case)
Demand & orders – Orders refill in line with burn rate; backlog fluctuates around ₹ 2,000-2,200 cr for most of the year.
Capacity & utilisation – 70-75 % utilisation; first incremental output from debottlenecking.
Pricing / mix – Product mix broadly unchanged; exports grow to ₹ 500 cr (17 % of sales).
EBITDA margin – 24 % (flat YoY); raw-material costs move sideways; limited operating-leverage upside.
Working capital – Debtor days drift down to ≈ 140, inventory 85 days, creditors 110 days ⇒ CCC ~115 days; CFO ≈ 60 % of EBITDA.
Cap-ex / leverage – Routine maintenance + initial engineering for cell-plant; net-debt/eq edges up to ~0.15 × by year-end.
Macro / policy – Routine subsidy disbursal lags of 90-120 days; commodity costs benign.
Bear (downside safety-test)
Demand & orders – Only ₹ 1,100-1,200 cr new orders; backlog slips below ₹ 1,400 cr as state elections stall tendering.
Capacity & utilisation – 60-65 % utilisation; under-recovery on fixed costs.
Pricing / mix – Order book tilts toward lower-margin states; inverter/structure share falls back to 28 %.
EBITDA margin – 22 % as mix weakens and operating-leverage fades.
Working capital – Debtor days stretch to ≈ 160; inventories rise to 95 days amid panel-price volatility; CCC > 140 days; CFO ≤ 40 % of EBITDA.
Cap-ex / leverage – Must draw additional WC lines; net-debt/eq climbs toward 0.30 ×; cell-plant start may be deferred.
Macro / policy – PM-KUSUM subsidy releases slow to 150-180 days; potential panel-price spike of 5-7 %.
8.2 Rationale for Continuing or Increasing Exposure
Demonstrated earnings leverage: In FY 25, profit after tax advanced 188 percent on revenue growth of 84 percent while maintaining a 24 percent EBITDA margin—evidence that the margin expansion is structural.
Secured growth pipeline: An order book of approximately ₹ 1,650 crore, together with live tenders in key states and exports, largely underwrites management’s ≥ ₹ 3,000 crore revenue target for FY 26.
Available capacity: Recent doubling and quadrupling of pump, VFD and structure lines permit additional throughput with minimal incremental capital expenditure, enhancing operating leverage.
Reasonable valuation: The shares trade at roughly 21 times FY 26E earnings and 14 times FY 26E EV/EBITDA—modest for a company guiding to 20 percent top-line growth, 24 percent margins and ROE above 30 percent.
Solid balance-sheet: Net-debt-to-equity stands at 0.1 ×, with interest cover of 13.6 ×, providing ample headroom to finance the planned solar-cell facility without equity dilution.
Unrecognised optionality: The planned 2 GW DCR solar-cell plant and nascent EV drivetrain and rooftop-solar verticals are effectively excluded from current valuations.
Cash-flow upside: Every 10-day reduction in debtor days releases roughly ₹ 70 crore, turning FY 25’s negative free cash flow positive and potentially supporting higher shareholder returns.
Sustained policy tailwinds: PM-KUSUM Phase II funding, state solar-irrigation mandates and export demand from water-stressed regions furnish multi-year volume visibility beyond FY 26.
8.3 Key Risks & What to Monitor
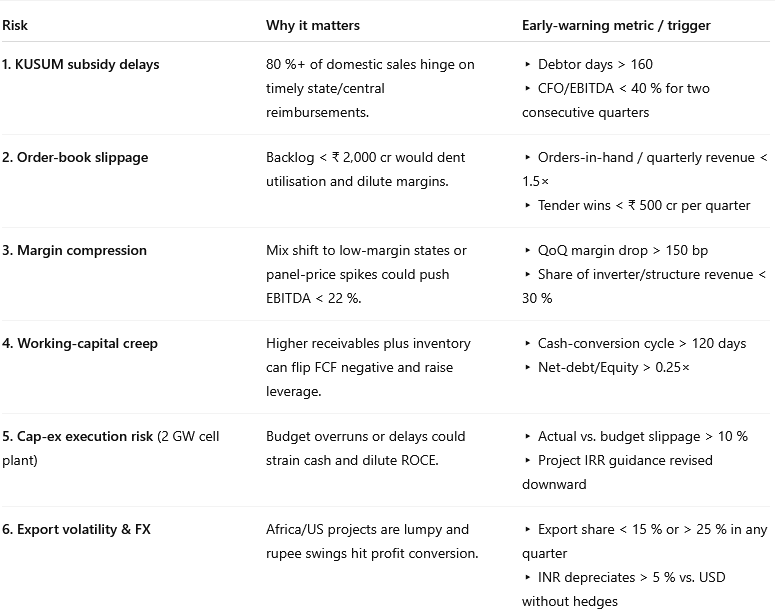
8.4 Shakti Pumps — Margin of safety seems thin
Shrinking backlog
Order book has fallen from ≈ ₹ 2,400 cr (Mar-24) to ≈ ₹ 1,650 cr (May-25)—now only about 0.6 × FY-25 sales.
Barely six-months’ revenue cover; any tender lull risks under-utilisation and margin erosion.
High expectations baked in
Shares still trade near 21 × FY-26E P/E and 14 × EV/EBITDA.
A 10 % revenue or margin miss could drag the multiple to mid-teens, slicing 20–25 % off the price.
Working-capital drag
Debtor days sit at 152 (vs 120 target); FY-25 free cash flow was negative.
Thin cash cushion; higher receivables force borrowing just as backlog is light.
Policy concentration
More than 70 % of domestic sales rely on PM-KUSUM subsidies.
Budget delays widen receivables and could cancel orders—particularly painful when backlog is low.
Previous Coverage of SHAKTIPUMP

Don’t like what you are reading? Will do better. Let us know at hi@moneymuscle.in
Don’t miss reading our Disclaimer