
SG Finserve Q1 FY26 Results: PAT up 26%, Doubling PAT in FY26
PAT CAGR of 65% and AUM CAGR of 61% targeted for FY25–27, available at undemanding valuations, but requires a faster AUM and PAT run-rate to meet FY26 targets
Confused about AUM, ROA and ROE in NBFC’s? Gain clarity now.

1. NBFC — Supply Chain Financing
sgfinserve.com | NSE: SGFIN
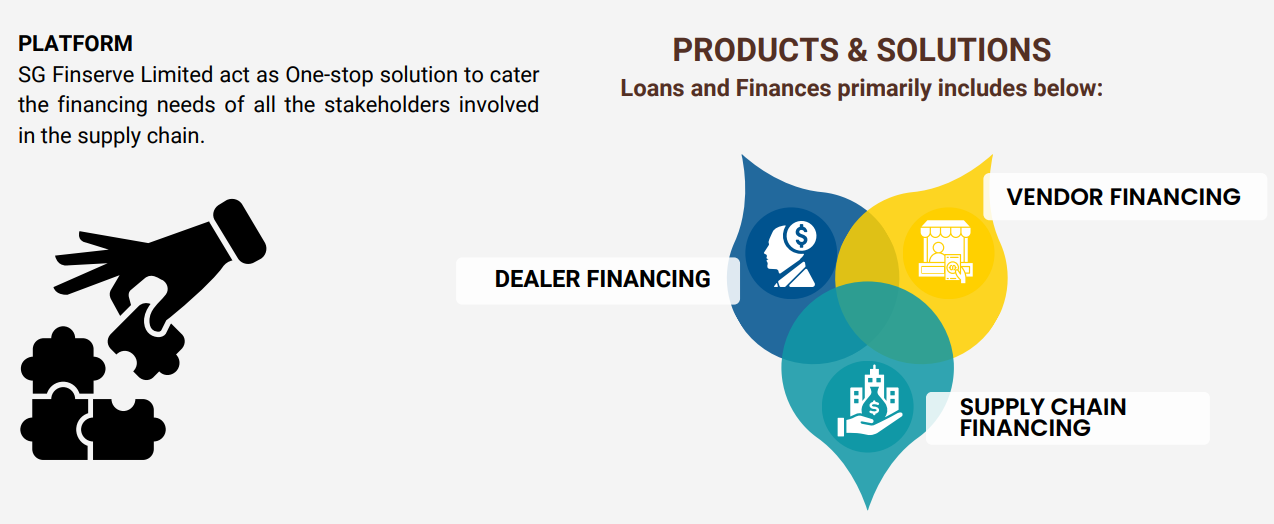
Business Mix & Portfolio
Supply chain financing for us constitutes about 85% of our book, with major focus is on dealer financing. So, out of that, about 90% of our book would constitute dealer financing only.
So, our main focus, forte, is conducting dealer financing portfolio only
2. FY23-25: PAT CAGR 112% & Total Income CAGR 113%

3. FY-25: PAT up 3% & Total Income up 1%

After a regulatory-driven pause in H1 to comply with Type II NBFC licensing norms, the company bounced back strongly in H2, scaling disbursements, expanding its loan book, and maintaining zero NPAs. Despite the temporary slowdown, SG Finserve closed the year with stable profitability and a strengthened foundation for future growth.
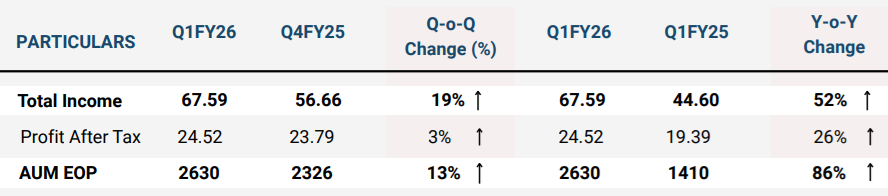
4. Q1-26: PAT up 26% & Total Income up 52% YoY
PAT up 3% & Total Income up 19% QoQ
Headline Performance
AUM (EOP — End of Period): +13% QoQ, +86% YoY
Gross Disbursements: +4% QoQ, +22% YoY
PAT: Muted due to ESOP expense in Q1.
Gross NPAs: NIL — continued clean asset quality
Annualised ROA / ROE: 4.68% / 9.54%
Operational Efficiency
Average Loan Book Churn: Improved to ~30 days (36 days in Q4-25)
Faster capital recycling & higher velocity.
Opex: Q1 opex at ~70–75 bps of AUM; expected to decline to ~50 bps by FY27
Cost of Funds: Reduced by ~30 bps QoQ to ~8.25%, supported by AA(CE)/A1+ credit ratings from CRISIL & ICRA.
SG Finserve delivered Q1 FY26 growth despite ESOP cost drag on PAT. The anchor-led, tech-enabled, secured lending model continues to scale well with low NPAs and improving velocity. Growth visibility into FY26–27 is high, supported by large unutilised MOU limits and sector diversification plans.
5. Business Metrics: Muted Return Ratios

Despite a lower ROE in FY25, the structural indicators remain healthy
6. Outlook: PAT Doubling in FY26
6.1 Management Guidance and Future Outlook
FY26 Guidance
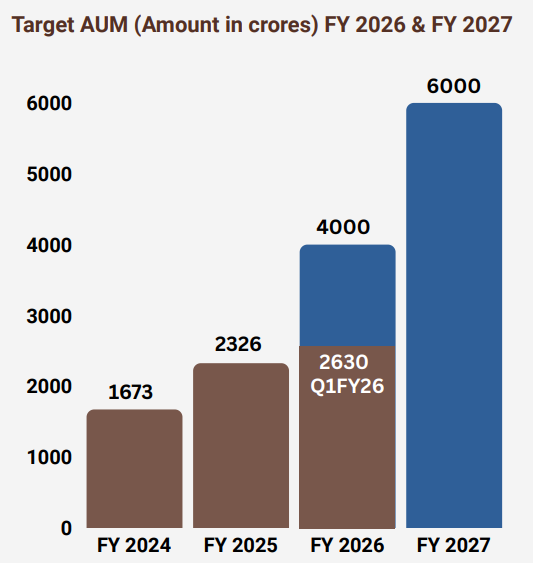
Fully geared up to take the current loan book, which stands at INR2,600 crores to INR3,500 crores-INR4,000 crores by FY26
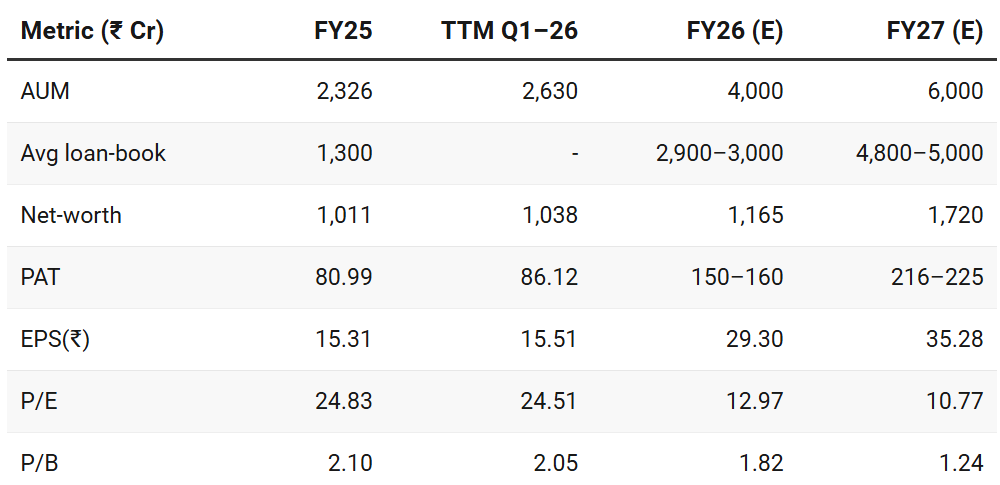
Average loan book for FY '26 is expected to be around INR2,900 crores to INR3,000 crores
We should be near about INR150 crores, INR160 crores kind of PAT level
PAT Doubling to ~₹150–₹160 Cr (suppressed in FY26 due to ₹9.9–₹10 Cr ESOP charge; normalizing in FY27).
FY27 Guidance
Confident that we should be able to achieve a INR6,000 crores loan book by end of FY27 with maintaining 15% to 18% ROE and 4.5% ROA.
Average loan book for the next financial year that is expected to be around, is expected to be between INR4,800 crores to INR5,000 crores.
The equity portion in INR3,000 crores of average book would be about INR1,000 crores of equity and when we do INR5,000 crores, the average equity position would be about INR1,500 crores.
Equity Base: Will rise by ₹338 Cr balance warrant conversion (due April 2026) — earnings dilution in FY27
Growth Drivers
Anchor Expansion & Deep Penetration
MOUs with anchors worth ₹6,400 Cr (+₹900 Cr QoQ); 48 leading corporates onboarded (Tata, Adani, JSW, APL Apollo, etc.).
Growth pacing dependent on timely execution of anchor programs & product launches.
Strong pipeline and anchor programs not yet fully utilized (current AUM is <50% of signed MOU size).
Reduce branch coverage radius from 225 km to ~150 km to improve dealer coverage.
Tier-2 city penetration underway.
Sector Diversification
Current exposure in building materials (~60%) and automobiles (~20%).
Expanding into IT peripherals, mobiles, wires & cables (e.g., Polycab), consumer durables (e.g., Whirlpool, Saint-Gobain).
Avoiding highly competitive sectors like paints and cement for now.
Risk Management: Strict borrower selection (3–5 year anchor relationship, majority business from anchor)
Management Confidence
Confident in meeting FY26 and FY27 AUM targets despite broader economic slowdown due to high-demand sectors and anchor-led model.
6.2 Q1 FY26 Performance vs FY26 Guidance – SG Finserve
AUM & PAT run-rate needs to accelerate to meet guidance
AUM: Needs strong growth to deliver on ₹4,000 Cr guidance vs Q1-26 end ₹2,630 Cr
Q2–Q4 AUM addition must average ₹457 Cr vs ₹304 Cr in Q1-26
1.5x Q1-26 AUM addition
PAT: Running behind required run-rate
Q2–Q4 must average ₹42–45 Cr PAT vs ₹24.52 Cr in Q1-26
1.7-1.8x Q1-26 PAT
7. Valuation Analysis — SG Finserve
7.1 Valuation Snapshot
CMP ₹380.10; Mcap ₹2,124.57 Cr
Earnings Dilution (FY27): 15% dilution in EPS
Base shares 5.5895 Cr + Warrants 1 Cr = Diluted shares 6.5895 Cr
P/E (×)
TTM Q1–26: 24.51× — market pricing in future earnings in line with high-growth NBFC peers.
P/E compression due to strong earnings growth—indicating potential for valuation re-rating if growth is delivered.
P/B (×)
TTM Q1–26:: 2.05× — typical for profitable, high-growth NBFCs with strong asset quality.
FY27 (E): 1.24× — suggests valuation could be undemanding if growth/ROE targets are met.
Summary View
Forward P/E ~10.8× is modest for a secured NBFC growing PAT at ~65%+ CAGR
Forward P/B ~1.24× is low for an NBFC with nil NPAs and high churn.
On forward metrics, the stock appears reasonably valued with upside if management delivers on FY27 targets.
7.2 Opportunity at Current Valuation
Undemanding Forward Valuation
P/E ~10.8×, P/B ~1.24× (FY27E ) supported by
AUM CAGR (FY25–FY27) — ~61%
PAT CAGR (FY25–FY27) — ~65%
Anchor-led, secured model (80% secured) with nil NPAs supports predictable yields.
Operating leverage + faster churn (30 days) could lift ROE toward 15–18%.
Sector tailwinds: formalisation of MSME credit, Tier-2/3 penetration.
7.3 Risk at Current Valuation
Risk of Delivering Growth Guidance
Requires strong AUM growth QoQ and PAT delivery to meet FY26 targets
~80% of lending in building materials and auto exposes SGFIN to sector-specific cycles and risks
Muted Q1-26 AUM growth QoQ: Product launches of some of the anchors got delayed and have moved to the month of July.
Lowered Profitability Expectations
SGFIN lowered profitability expectations from Q4-25 to Q1-26 earnings call and needs to be watched for:
ROA guidance lowered — 4.5-5% in Q4-25 to 4.5% in Q1-26 call
ROE guidance lowered —18-20% in Q4-25 to 15-18% in Q1-26 call
Q4-25 earnings call: We are confident that we can take this loan book from INR2,300 crores to INR4,000 crores in 12 months and INR6,000 crores by FY27 and while growing this loan book, we are being very prudent that we continue to achieve ROE of 18% to 20% with ROA of 4.5% to 5%
Don’t like what you are reading? Will do better. Let us know at hi@moneymuscle.in
Don’t miss reading our Disclaimer