
Lloyds Metals & Energy FY25: PAT up 17%, Mining Clearance to Drive FY26 Results
Mining to 2X+ in FY26. Transforming from India’s largest iron ore mine to an integrated steel producer — with upside fully tied to executing without a miss,
1. Iron ore miner transforming into an integrated value added steel producer
lloyds.in | NSE: LLOYDSME

2. FY21-25: PAT CAGR of 64% & Revenue CAGR of 24%

**FY23 PAT is negative due to a ₹1,194 Cr exceptional loss (arbitration settlement).
3. Q4-25: PAT down 27% & Revenue Flat YoY

Q4-25 was a soft quarter driven by volume tapering and one-time expenses, but the underlying margin profile remains intact. With the Mine expansion EC (environmental clearance) in place, LMEL is poised for a much stronger operating performance ahead.
4. Strong FY25: PAT up 17% & Revenue up 3%
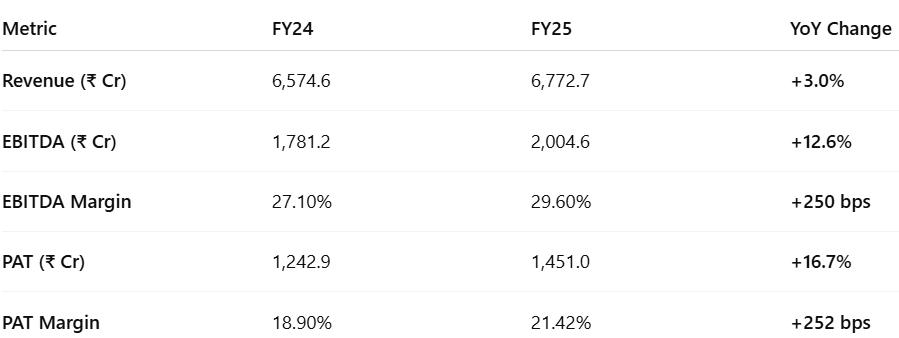
Topline growth was modest (+3%), limited by regulatory bottlenecks (pending EC for 25 MTPA expansion — received in May-25).
Profitability growth was robust, with EBITDA and PAT rising at double digits despite flattish revenue—signaling strong margin control.
EBITDA margin expanded to nearly 30%, the highest in LMEL's reported history, driven by:
Higher iron ore realizations
Cost savings from operating leverage and captive infrastructure (pipeline, power)
PAT margin improved to 21.4%, reflecting efficient tax management and lower finance costs.
Overall, FY25 was a margin-led growth year, positioning the company for a major revenue breakout in FY26 and beyond once capacity ramps up.
5. Business metrics: Strong Return Ratios Muted by Capex

The dip in FY25 ROE & ROCE to 26.4% is optical, not fundamental. It’s due to aggressive capex ahead of revenue recognition. Ex-CWIP, Lloyds continues to operate at best-in-class return levels, confirming the efficiency of its commissioned assets.
6. Outlook: Iron ore volume to 2X+ in FY26
6.1 FY25 Expectations vs Performance – Lloyds Metals
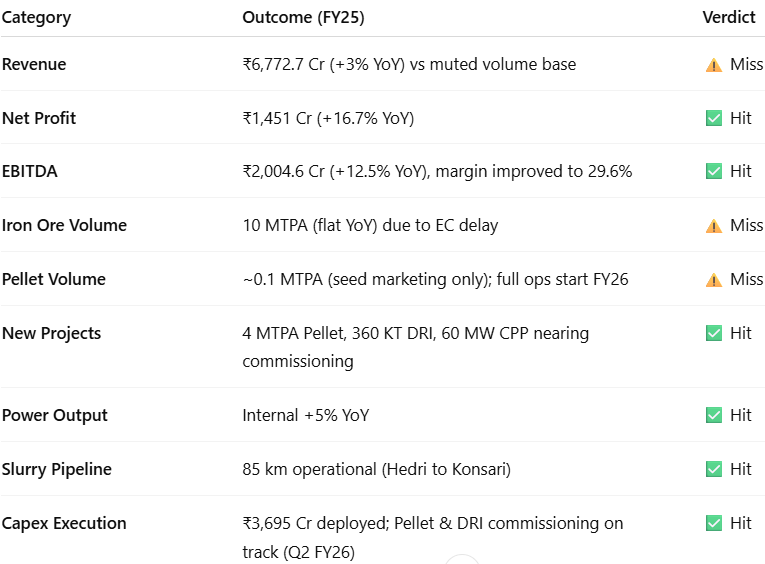
✅ Hits: What Went Right
PAT up 17% YoY despite flat revenue
EBITDA up 12.5% YoY; margin improved to 29.6%
₹30 Cr of ESOP + CSR absorbed without margin damage
Slurry pipeline commissioned and operational
Pellet (4 MTPA), DRI (360 KT), CPP (60 MW) near commissioning
₹3,695 Cr capex deployed; next phase (steel, pellet 2) underway
Margins held strong despite sponge/power pressure
Pellet marketing kicked off (RINL win)
Logistics/pricing strategy ready for FY26 volume ramp
❌ Misses: What Fell Short
Iron ore volume flat at 10 MTPA (EC delay)
26 MTPA ramp pushed to FY26
Revenue up only 3% YoY, below expectations
Q4 weaker due to front-loaded dispatches
No pellet/steel revenue yet; contributions start FY26–28
Q4 EBITDA margin dipped to 23.1% (vs 32.7% in Q3)
Impact from lower volume + ESOP + CSR + ramp-up costs
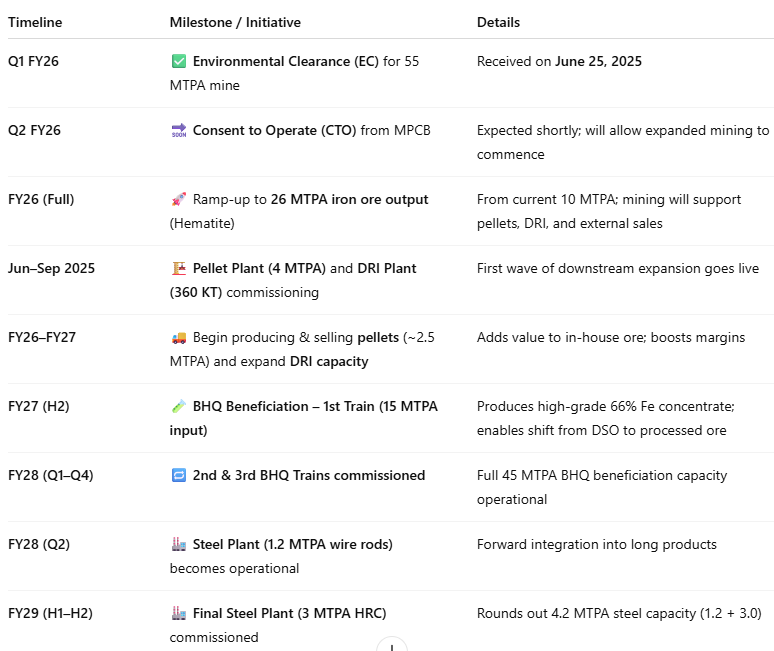
6.2 Future Outlook: FY26 and Beyond
Mining Expansion Approved: EC received on June 25, 2025 for:
Increasing iron ore mining capacity to 55 MTPA
This makes Lloyds India’s largest iron ore miner
Operations to begin post-approval of Consent to Operate (CTO) from Maharashtra Pollution Control Board (MPCB), expected shortly
Phased Mining Ramp-up Plan
Phase 1: 26 MTPA of Hematite (DSO) to be mined initially
Phase 2: Gradual transition to BHQ beneficiation, with 45 MTPA input
Long-term plan: shift from DSO to world-class pellet and sinter-feed concentrate
Integrated Steel Vision
Capex underway for:
12 MTPA pellet capacity & 4.2 MTPA steel capacity
Slurry pipelines, captive power, and logistics
Strategy focuses on cost-effective and sustainable steel production
Cost & Margin Guidance
EBITDA margin expansion driven by:
In-house iron ore supply
Integrated operations (mining → pellets → steel)
Capex efficiency
Long-term aim: Become India’s most efficient and lowest-cost steel producer
Summary
Strategic Transformation By FY29

Key Management Themes
Cost leadership through in-house ore + pelletization + steel integration
Green infrastructure: slurry pipelines, LNG vehicles, battery-operated equipment
7. Valuation Analysis — Lloyds Metals
7.1 Valuation Snapshot
P/E @ CMP = 59.5
P/Sales 12.0×
EV/EBITDA 40.5×
TTM Basis:: Lloyds is trading at multiples, which are significantly higher than typical commodity or steel businesses.
Why?: The market is pricing in future monetization of steel, pellet, and BHQ capacity, which haven’t contributed materially in FY25.
Reality Check:FY25 earnings reflect mostly iron ore + early-stage DRI, while ~₹42,000 Cr of under-construction assets (CWIP) are yet to generate revenue.
Lloyds Metals appears overvalued on FY25 earnings, but the premium reflects investor confidence in future scale-up and margin expansion. Valautions are expensive, but valuation may normalize if FY27 EBITDA sales up as mining scales up and value addition projects come online.
7.2 What’s in the Price?
The current valuation (~59.5× P/E TTM, ~40.5× EV/EBITDA) reflects high investor confidence in full ramp-up by FY27–28.
Implied valuation assumes:
Smooth iron ore ramp-up to 26 MTPA post EC
Pellet and DRI margins hold at projected levels
Steel plant execution (1.2 + 3.0 MTPA) stays on track
BHQ beneficiation output meets quality/yield expectations
Any delay in monetization, volume ramp, or cost overrun may trigger a sharp de-rating.
7.3 What’s Not in the Price?
Several upside triggers remain underappreciated:
New Segment Upside:
Steel plant EBITDA not yet priced — ramp-up begins FY27–28
BHQ beneficiation (66% Fe concentrate) could add premium realisation
Profit Leverage Triggers:
Slurry pipeline savings (₹400–600/ton) from Hedri to Ghugus yet to reflect in unit cost
IPS subsidy accruals (SGST + royalty refunds) not factored into current P&L valuation
2nd pellet plant (FY27) and full 4.2 MTPA steel still treated as under construction
Asset-Light Expansion:
No credit given for Thriveni MDO scalability, export potential, or possible M&A/joint ventures
Steel market tailwinds (tariff protection, infra push) underweighted in consensus models
7.4 Risks and What to Monitor
Valuation Risk: Market is pricing clean execution — any delay could compress multiples
Execution Risk:
Pellet/DRI delay or CTO hold-ups could hurt FY26 volumes
Steel construction risk increases as projects expand to Ghugus
Regulatory & Market Risk:
Royalty/tax regime on iron ore or policy changes around beneficiation
Steel price cycles and Chinese export behavior may impact realisations
Capex Absorption Risk: ₹6,000–6,500 Cr FY26 capex must be absorbed without overleveraging or RoCE dilution
Volume Concentration Risk: Iron ore remains dominant in FY25–26 — weak volumes or pricing dip can affect overall profitability
What to Monitor

Lloyds’ current valuation rewards execution certainty — but leaves little room for missteps. However, the upside remains significant if pellet, steel, and BHQ projects monetize as planned. This is a “capex now, rerate later” story: delivery over the next 12–18 months will define re-rating or derating trajectory.
8. Implications for Investors
8.1 Bull, Base & Bear Scenarios — Lloyds Metals & Energy
Bull Case (Probability = Moderate)
Pellet and DRI plants ramp up faster than planned
PAT margin expands above 25%, aided by IPS benefits and strong realisations
BHQ beneficiation output scales smoothly with premium Fe content
Steel plant (1.2 MTPA) delivers early, cost structure outperforms peers
Base Case (Probability = High)
FY27 Pellet + DRI fully contributing
PAT margin holds at 21–23%, RoCE sustains above 25%
Steel contribution begins in FY28, BHQ trains go live as scheduled
25–30% PAT CAGR from FY25 to FY29
Bear Case (Probability = Moderate)
Delay in CTO, pellet or steel commissioning impacts FY26–27 earnings
PAT margin compresses to 18–19% due to lower volumes or steel margin headwinds
BHQ plant or steel ramp-up delayed to FY29; ROCE dips below 20% during peak capex
8.2 Is There Any Margin of Safety?
✅ Where There Is Margin of Safety
Business Model & Integration
Fully integrated mining-to-steel roadmap, with raw material security locked in till 2057
In-house iron ore, pellet, power, and upcoming steel capacity = high structural margin stability
FY25 EBITDA margin at 29.6%, one of the highest among peers
Capital Structure
Net debt remains minimal (~₹16 Cr); net debt/EBITDA < 0.01x
No need for dilution or external funding despite ₹6,000+ Cr capex planned in FY26
Capex is self-funded, reducing financing risk and preserving ROE/ROCE
Execution Not Fully Priced
Steel and BHQ capacity not contributing to FY25 EBITDA — priced conservatively
If PAT grows from ₹1,451 Cr (FY25) to ₹3,000–3,500 Cr as mining capacity increases from 10 MTPA to 26 MTPA, implied FY27 P/E drops below 20x
IPS subsidies and slurry pipeline savings (~₹100 Cr+ annual impact) not yet visible in P&L
❌ Where There Isn’t Margin of Safety
Expensive Valuations
FY25 P/E ~59.5x, EV/EBITDA ~40.5x — pricing in full execution with no room for error
These are tech-like multiples for a capital-heavy business — rare unless FY27 EBITDA scales significantly
Execution Risk Persists
CTO approval still awaited (as of June 2025)
Pellet, DRI and steel plant commissioning timelines critical — any delay = missed PAT targets
Steel pricing cyclicality and BHQ yield uncertainty remain key sensitivities
No Cushion for Disappointment
If FY26 PAT or volume guidance is missed, stock could quickly de-rate to 18–20x P/E
High expectations built in: any slip in execution or margin compression may trigger sharp correction
Margin of safety lies more in the business fundamentals than in the stock price.
Lloyds is pricing in perfect execution. However, if pellet + steel + BHQ monetize as guided by FY27, earnings will catch up and justify current levels — or higher.
Previous coverage of LLOYDSME

Don’t like what you are reading? Will do better. Let us know at hi@moneymuscle.in
Don’t miss reading our Disclaimer