
KPI Green Energy Q4 FY25 Results: PAT Doubles, Guides for Strong Growth Till FY30
KPI Green beat FY25 growth guidance; targets 60% revenue CAGR and 10+ GW capacity by FY30. Margin stability holds, but execution is key to upside.
1. Renewable power generating company in Gujarat
kpigreenenergy.com | NSE: KPIGREEN

2. FY21–25: PAT CAGR of 111% & Total Income CAGR of 67%

Hyper Growth Mode: Total income and EBITDA have grown at 67–70% CAGR, highlighting strong project wins, execution capabilities, and scale efficiencies.
Margin Stability Despite Scaling: EBITDA margins have normalized from the early high base but remain healthy at ~33%—a sign of operational discipline.
PAT Surge: Net profit compounded at 111% CAGR, reflecting the operating leverage at play and efficient capital deployment.
Improved Profit Quality: PAT margin stability around 16–18% indicates that growth is accompanied by profitability, not just topline expansion.
3. Q4 FY25: PAT up 142% & Revenue up 97% YoY
PAT up 53% QoQ & Revenue up 15% QoQ

Sharp YoY Profit Jump: PAT more than doubled YoY, driven by stronger capacity monetization and cost leverage in IPP assets.
Margin Lift QoQ: Despite EBITDA margin staying flattish sequentially, PAT margin improved significantly—reflecting lower interest outgo and depreciation absorption.
Sustained Execution Momentum: Quarterly revenue crossed ₹550 Cr for the first time, signaling continued delivery against the high order backlog.
Consistent QoQ Expansion: PAT has now grown for three consecutive quarters, underlining execution stability and cash flow visibility.
4. FY25: PAT up 101% & Total Income up 70% YoY

Guidance Outperformance: Management had guided for ~60% YoY growth, but actual income growth came in higher at 70%, indicating strong execution against a high base.
Capital Efficiency Gains: PAT doubling despite flat margins shows better working capital rotation, interest efficiency, and scale in recurring IPP cash flows.
Sustainable Profitability: EBITDA margins remained stable at ~33%, reaffirming disciplined execution even as the company scaled up rapidly.
Clear Line of Sight for FY26: With a robust order book and high commissioning visibility, KPI is well-positioned to maintain the FY26 growth guidance of ~60% YoY.
5. Business metrics: Steady return ratios

Multi-Year Improvement: ROE and ROCE climbed steadily from FY21 to FY24, driven by operational efficiency and strong execution.
FY25 Return Compression: Returns moderated in FY25 due to higher capital employed, with equity tripling YoY as the company scaled.
Healthy Profitability Maintained: Even with equity dilution, KPI delivered high-teen ROE and double-digit ROCE, reflecting efficient asset monetization.
7. Outlook: Revenue CAGR of up to 60%
FY25 Commentary Highlights
CMD Faruk Patel reiterated KPI Green’s long-term commitment to becoming a leading renewable energy platform with a target of 10+ GW capacity by FY2030.
The company executed strongly in FY25 with 70% revenue growth and 101% PAT growth, backed by expansion in both IPP and CPP portfolios and strong operating leverage.
EBITDA margins remained steady at 33.1%, demonstrating the stability of its annuity-led IPP model even as the company scaled aggressively.
6.2 FY26 & Beyond: Strategic Guidance
Revenue Growth: KPI is targeting 60% YoY revenue growth in FY26, in line with its guided multi-year CAGR. This is expected to be driven by project commissioning, new PPA signings, and asset monetization across its 2.95+ GW pipeline.
Profitability: Management expects EBITDA margins to remain stable or slightly improve due to greater asset utilization, O&M efficiencies, and scaling of high-margin hybrid projects.
Project Pipeline Execution:
Over 950+ MW installed capacity till FY25, with another 1,200+ MW in advanced stages of implementation.
Land bank of 5,946+ acres and 3.26+ GW evacuation capacity ensures execution headroom without major bottlenecks.
New Growth Verticals:
KPI is developing a 1 MW green hydrogen project and piloting BESS (Battery Energy Storage System) solutions, both expected to begin contributing from FY26 onwards.
Exploration of offshore wind and floating solar segments is underway, with potential to diversify revenue and improve capacity utilization.
6.3 Long-Term Vision (FY30 Horizon)
KPI Green aims to transition from a mid-sized renewables player to a 10+ GW pan-India green energy platform.
Growth will be a mix of IPP-driven annuity revenues and strategic CPP/O&M partnerships across industrial and MSME clients.
Focus remains on maintaining capital discipline while unlocking emerging optionality in green hydrogen, storage, and hybrid optimization.
7. Valuation Analysis
7.1 Valuation Snapshot – KPI Green Energy Ltd.
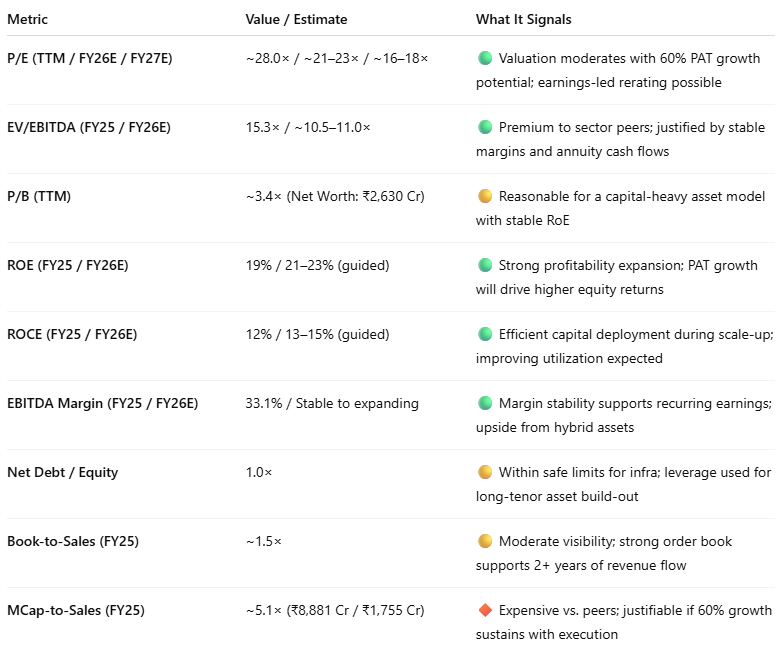
KPI Green trades at ~28× P/E and ~3.4× P/B — levels that imply expectations of consistent PAT growth. EV/EBITDA of 15.3× reflects annuity-like cash flows and execution reliability. Management’s guidance of 60% revenue CAGR till FY30 underpins the valuation. However, future upside hinges on project commissioning pace, asset monetization, and return on capital expansion from the current base.
7.2 What’s Priced In
The current valuation of KPI Green Energy — with P/E at ~28×, P/B at ~3.4×, and EV/EBITDA at 15.3× — reflects investor confidence in the following:
60% Revenue Growth Outlook: Management’s guidance of 60% annual revenue growth till FY30 appears largely priced in, especially given the FY25 growth of 70% and consistent project execution.
Strong Margin Profile: The company delivered a 33.1% EBITDA margin in FY25, and market assumes this annuity-like margin profile will sustain due to high IPP share and O&M integration.
Healthy Return Ratios: RoE at 19% and RoCE at 12% signal disciplined capital allocation and scalable asset returns — supporting valuation premiums.
Robust Balance Sheet: Net debt-to-equity at 1.0x is manageable for infrastructure assets. Equity tripling in FY25 gives headroom to scale without immediate dilution.
Execution Credibility: Proven track record of delivering large-scale solar and hybrid projects on time — including across Gujarat’s DISCOMs and industrial corridors — underpins investor confidence in future capacity additions.
Institutional Ownership Confidence: Backing from Vanguard, BlackRock, Goldman Sachs, and SBI General Insurance suggests sustained institutional conviction in KPI’s long-term model.
7.3 What’s Not Priced In
Despite strong fundamentals and rising interest, the market may not have fully factored in the following potential upside drivers:
BESS & Green Hydrogen Projects (FY26 Onwards): Pilot initiatives in Battery Energy Storage and a 1 MW Green Hydrogen plant are expected to go live by FY26. Execution success here could open high-margin adjacencies not yet reflected in consensus.
Offshore & Floating Solar Projects: KPI is evaluating entry into offshore wind and floating solar via reservoir-based installations. These asset classes offer land-efficiency and yield benefits that could drive a business model upgrade.
Faster RoCE Improvement: While RoCE compressed to 12% in FY25 due to higher capital employed, operating leverage from newly commissioned IPP/CPP capacity could drive a sharper-than-expected rebound in FY26–27.
Deleveraging Pathway: If PAT growth sustains while capex moderates, net debt reduction could improve equity efficiency and lower the cost of capital — aiding re-rating.
Valuation Rerating via Optionality: KPI’s shift into MSME segments, diversified PPA structures, and integrated tech platforms (like robotic cleaning and IBM-powered NOC) remain underappreciated levers in its long-term moat.
8. Implications for Investors: What to Watch
8.1 Bull, Base & Bear Case Scenarios

8.2 Why Investors May Want to Stay Invested or Add to KPI Green Energy
A. Strong Growth Visibility
Management has guided for 60% annual revenue growth till FY30, backed by a 2.95+ GW project pipeline, 950+ MW installed capacity, and ₹5,946+ acre land bank.
Estimated book-to-sales ratio of ~1.5× implies 2+ years of visibility on project execution and topline growth.
B. Earnings-Led Valuation Control
Stock trades at ~28× TTM P/E and ~15.3× EV/EBITDA — rich but justified by annuity cash flows and 70% PAT growth in FY25.
With PAT compounding at over 60%, forward P/E can compress to ~20–22×, offering upside via rerating.
C. Capital Productivity Remains Healthy
ROE at 19% and ROCE at 12%, despite a tripling of equity base — demonstrates disciplined capital deployment and potential for further improvement as new assets generate returns.
Net Debt/Equity at 1.0× is manageable, providing headroom for scale without immediate equity dilution.
D. Execution Track Record & Project Optionality
Timely commissioning of IPP/CPP assets across Gujarat’s DISCOMs and industrial corridors.
PPA-based business ensures steady annuity flows, supporting predictable EBITDA and PAT growth.
E. Emerging Optionality from New Verticals
Active development of green hydrogen, battery energy storage, and offshore/floating solar provides future growth levers not yet priced into consensus models.
F. Clean Operating Book
No stressed or legacy orders. Focused only on self-developed and fully backed renewable assets with clear revenue models.
8.3 Risks Not Fully Discounted
While KPI Green’s outlook is strong, the market may not have fully factored in the following risks:
A. Execution Uncertainty
KPI does not disclose formal "order inflow" metrics. While pipeline size is large, conversion to commissioned projects can be affected by regulatory, land, or evacuation delays.
B. Capital Productivity Compression
FY25 saw a dip in ROCE to 12% due to a tripling of equity and upfront investments. If revenue fails to scale fast, return ratios could stay muted longer than expected.
C. High Capital Intensity
As a power asset owner, KPI requires continued access to low-cost debt and working capital. Sharp interest rate changes or liquidity constraints may disrupt project rollout timelines.
D. Optionality Is Not Yet De-risked
While initiatives like BESS and green hydrogen are promising, execution and revenue contribution timelines are still undefined, leaving upside unpriced and uncertain.
E. Macro & Regulatory Risks
Renewable infrastructure execution is vulnerable to state-level regulatory shifts, power evacuation challenges, and central allocation timelines, especially for large-scale IPP expansion.
8.4 Investor Segmentation Outlook – ITD Cementation

Previous coverage of KPIGREEN

Got Feedback on This Analysis? Let Us Know at hi@moneymuscle.in
Read the Full Disclaimer (Important)