
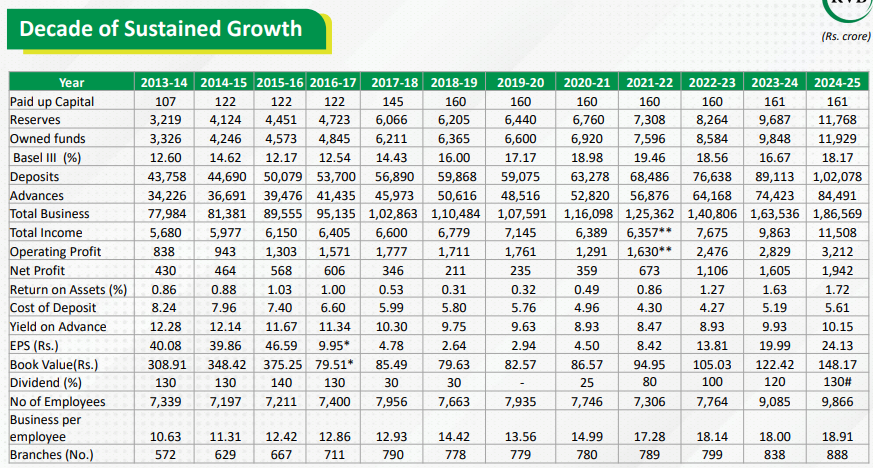
Karur Vysya Bank FY25 Results: PAT up 20%, FY26 Guidance Supports Growth Continuity
Valuation offers a cushion with strong downside protection, predictable earnings, and re-rating potential — making it an attractive bet for long-term investors
1. Mid-sized Private Sector Bank
kvb.co.in | NSE: KARURVYSYA
2. FY21-25: Operating Profit CAGR of 27% & Total Income CAGR of 16%
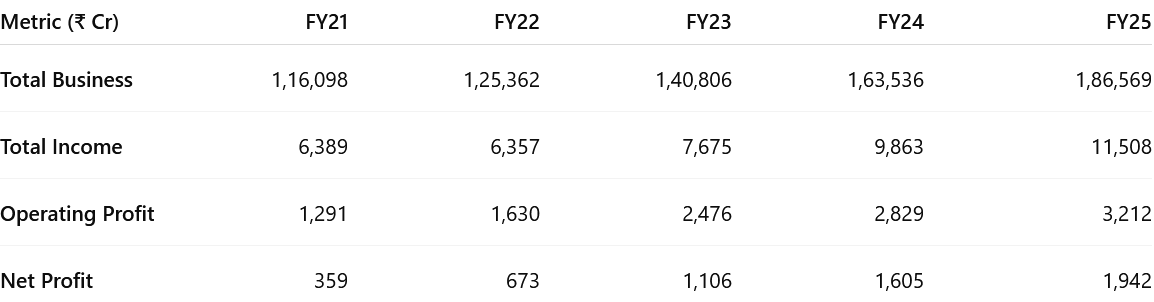
Total Business – CAGR: 12.6%
Expansion driven by RAM segment focus and stable deposit growth.
Total Income – CAGR: 15.9%
Faster than business growth; supported by higher yields and rising fee income.
Operating Profit – CAGR: 27.2%
Strong operating leverage; cost-to-income <50%; NIM held ~4%.
Net Profit – CAGR: 54.2%
Boosted by lower GNPA (7.94% → 0.76%), reduced credit cost, and stable margins.
2.1 What Changed Between FY21 and FY25 – Karur Vysya Bank
Profitability Transformed
Return on Assets (ROA) improved, signaling a shift from average to best-in-class profitability
Stronger Core Earnings
Total Income grew, aided by higher yields and better treasury contribution.
Net Interest Margin (NIM) consistently held above 4% through the period.
Balance Sheet Scaled Efficiently
Advances & deposits grew with a pivot to RAM (Retail, Agri, MSME) lending.
Despite growth, CRAR stayed strong (from 18.98% to 18.17%), with no capital raise.
Asset Quality Clean-Up
Gross NPA dropped, among the sharpest improvements in the industry.
Slippages and credit costs steadily declined, reflecting tight risk controls and quality origination.
Operational Efficiency Improved
Cost-to-Income Ratio improved despite investments in branches, tech, and workforce.
Employee productivity (business per employee) rose
3. Q4-25: Operating Profit up 13% & Net Interest Income up 9% YoY
Operating Profit up 3% & Net Interest Income up 1% QoQ
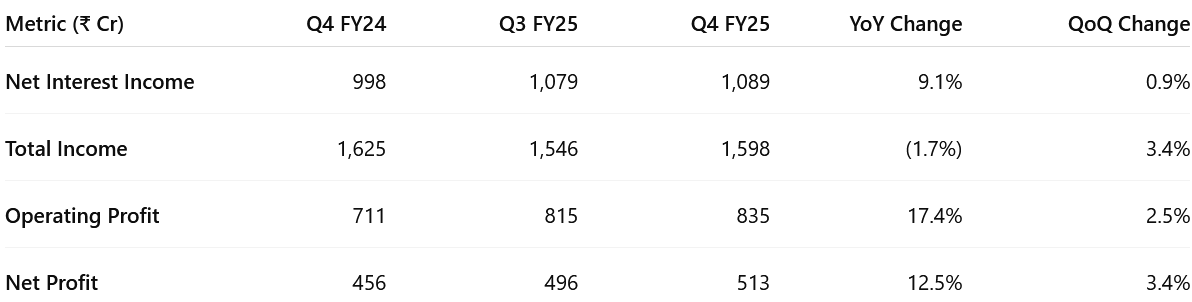
NII growth — driven by steady loan growth and stable NIM (~4.05%).
Total income — both fee and interest income gains.
Operating profit held firm despite cost increases from branch/tech investments.
Net profit — reflecting lower provisions and strong recoveries
4. Strong FY25: Operating Profit up 20% & Net Interest Income up 12% YoY
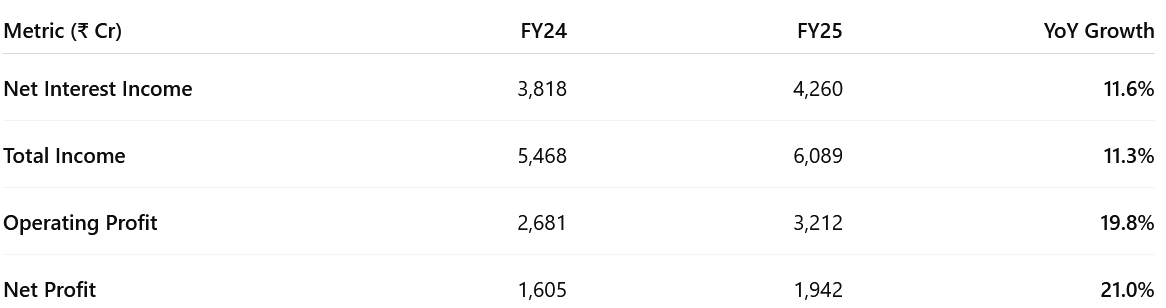
Net Profit grew 21%, underscoring improved asset quality, lower credit cost, and higher earnings efficiency.
FY25 marks a year of steady income growth & strong profitability expansion for KVB.
5. Business metrics: Strong & improving return ratios
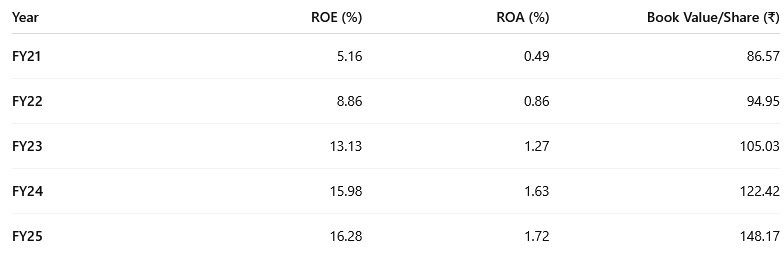
ROE: Driven by strong profit growth and better capital efficiency.
ROA: Reflects superior asset quality and core profitability.
Book Value/Share: Supported by high internal accruals, no dilution.
A high-quality improvement in returns, placing it among top mid-sized banks.
6. Outlook: Loan growth to be at ~14%
6.1 FY25 Performance vs. Guidance
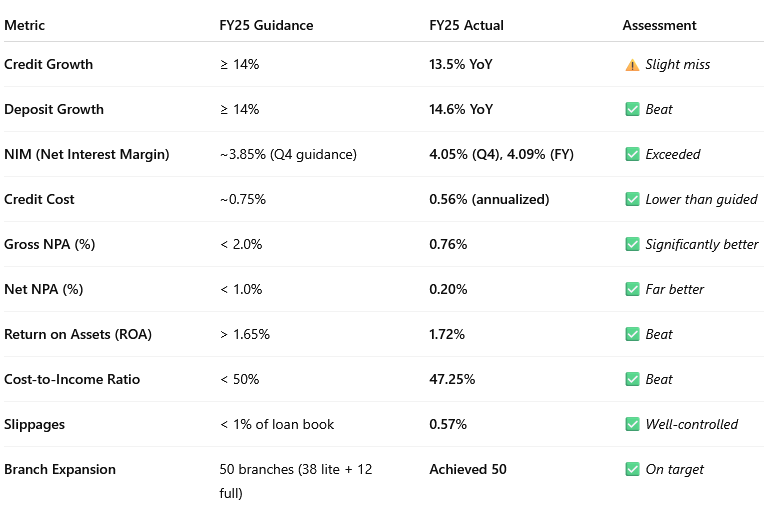
Emerging Pressure Area — CASA Ratio:
Fell to 27.3% (vs 30.4% in FY24); indicating pressure on low-cost deposits
Not formally guided but a key concern acknowledged by management.
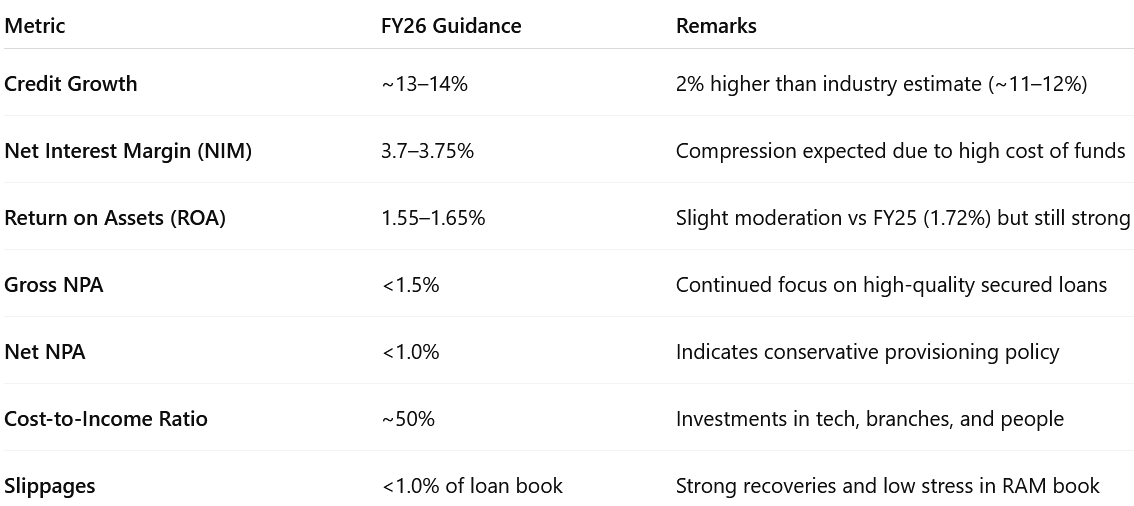
6.2 FY26 Guidance: Muted
Compression of NIM’s & Moderation RoA in FY26
Outlook for the Financial Year ’25-26 remains cautiously optimistic, we need to navigate margin pressures too and monitor asset quality closely.
There may not be any need to raise money in Financial Year ’25-26 for the growth plan.
Strategic Priorities
RAM-Led Growth: Focus on scaling Retail (gold, LAP), MSME (₹50–75L ticket), and secured Agri loans.
CASA Revival: Bank launched 24 new products, hired national sales heads, and targeted gov/institutional accounts.
Branch & Channel Expansion: Plan to open 100 branches (80 lite); enhanced sales team (33% now on CTC); integrated open market and branch sourcing.
Asset Quality Focus: Minimal unsecured exposure; gold-backed retail/agri book; cautious BNPL strategy with FLDG; low slippage trend to continue.
Digital & Operational Efficiency: 98% digital transactions; 5M+ app downloads; scaling analytics-led cross-sell and digital onboarding.
7. Valuation Analysis – Karur Vysya Bank
7.1 Valuation Snapshot
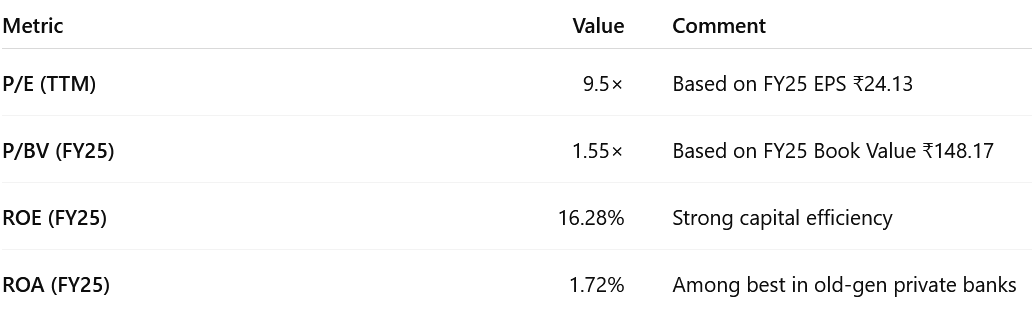
Undervalued relative to earnings power and return ratios
ROE > 16%, ROA > 1.7%, yet trading at <10× P/E
Scope for multiple re-rating if growth sustains and CASA stabilizes
Long-term thesis supported by strong internal accruals, no dilution, and high efficiency
7.2 What’s in the Price?
Return Ratios Re-rating: Market is factoring in 16%+ ROE and 1.6–1.7% ROA as sustainable, supporting 9.5–10× P/E and ~1.55× P/B valuations.
Earnings Base: PAT of ₹1,942 Cr is fully priced in, with slight moderation guided for FY26 (~1.55–1.65% ROA).
Execution Track Record: 5-year earnings CAGR >35% and superior asset quality lend valuation credibility.
Capital Efficiency: 16.3% ROE and strong internal accruals support rising book value without dilution.
Risk-Adjusted Growth: Prudent RAM-led expansion (~13% credit growth) priced in with margin stability.
7.3 What’s Not in the Price? (Upside Triggers)
Valuation Re-rating: Re-rating to 11–12× P/E could follow consistent earnings delivery in FY26.
CASA Stabilization: Improvement in CASA ratio could lower funding cost and lift NIM.
RAM Deepening: Higher growth from high-yielding MSME, gold loans, and LAP can drive NII upside.
Fee Income Levers: Scaling up insurance, digital payments, and corporate salary accounts may boost other income.
P/B Compression with Growth: Book value may cross ₹170 in FY26; valuation could normalize to 1.6–1.8× with visibility.
7.4 Risks and What to Monitor
Key Risks
Deposit Mobilization: Slower CASA improvement may pressure NIMs and ROA.
Loan Growth Lag: Delay in demand pickup or execution (especially in MSME) may cap growth.
Asset Mix Risk: Overexposure to gold loans and LAP could be sensitive to collateral volatility.
Provisions Spike: Any unexpected asset quality slippage may push credit cost above ~75 bps.
Re-rating Delay: Lack of catalyst (e.g., CASA traction, fee income pickup) could defer valuation expansion.
What to Monitor
NIM Trend: Whether NIM holds above 3.7% despite cost pressures from deposit repricing.
ROA Stability: FY26 guidance implies mild moderation—below 1.55% would raise concern.
Book Value Accretion: Watch for continued ~₹20+ annual increase in BVPS via internal accruals.
Loan Growth: Momentum in RAM segments will validate execution capability.
8. Implications for Investors
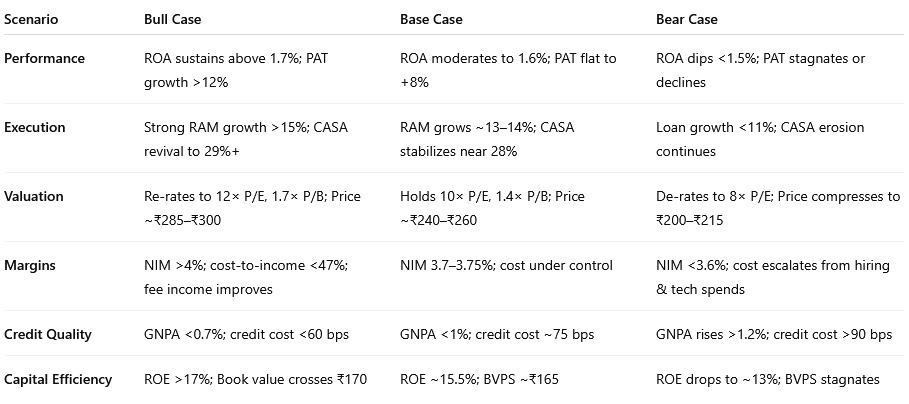
8.1 Bull, Base & Bear Case Scenarios – Karur Vysya Bank
8.2. Overall Margin of Safety: Moderate to High
Karur Vysya Bank offers a moderate-to-high margin of safety, driven by strong ROE, high asset quality, consistent internal accruals, and conservative valuations. While near-term valuation upside may be partially priced in, structural compounding levers remain intact.
What the Market Has Priced In:
FY26 Visibility: Management will performing strongly against FY26 guidance
BV Accretion: Book value growth driving P/B to ~1.3x
Valuation Stability: Consistently trades below peers despite ROA/ROE leadership.
No EPS Re-rating: Valuation reflects continuity, not aggressive upside.
Upside Optionality (Not in the Price):
CASA Revival: Improvement in CASA ratio could boost NIM and ROA.
Fee Income Scaling: Higher non-interest income via digital, wealth, and salary accounts.
P/E Re-rating: Re-rating to 11–12× P/E (from current 9.5×)
Downside Protection Factors:
Superior Asset Quality: GNPA (0.76%) and NNPA (0.20%) among the lowest in peer group.
Earnings Stability: PAT CAGR >35% over 4 years; resilient across rate cycles.
High RoE + Internal Accruals: 16.3% ROE supports compounding without dilution.
Capital Buffer: CRAR at 18.17% ensures no near-term equity raise.
Execution Track Record: 5 years of consistent performance across return and risk metrics.
Previous coverage of KARURVYSYA

Don’t like what you are reading? Will do better. Let us know at hi@moneymuscle.in
Don’t miss reading our Disclaimer