
Innova Captab FY25 Results: PAT Up 36%, FY26 Set for 40% Revenue Growth
Strong growth till FY28 driven by Jammu capacity ramp-up, branded exports, and margin expansion. Incentives, R&D scale-up, and attractive valuations offer upside
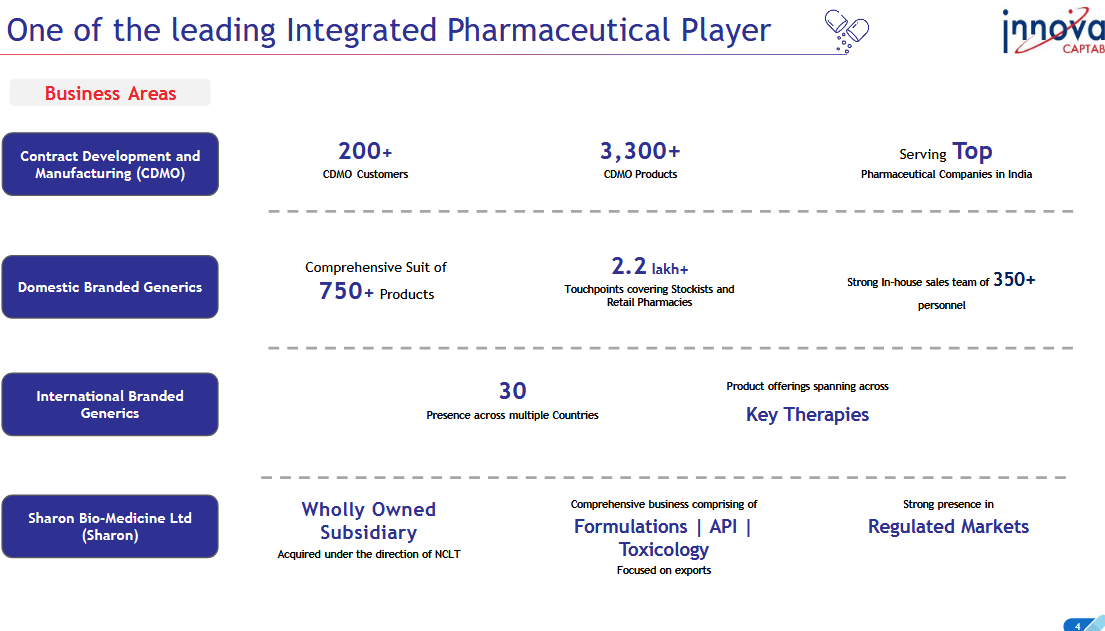
1. Pharmaceutical Company
innovacaptab.com | NSE: INNOVACAP
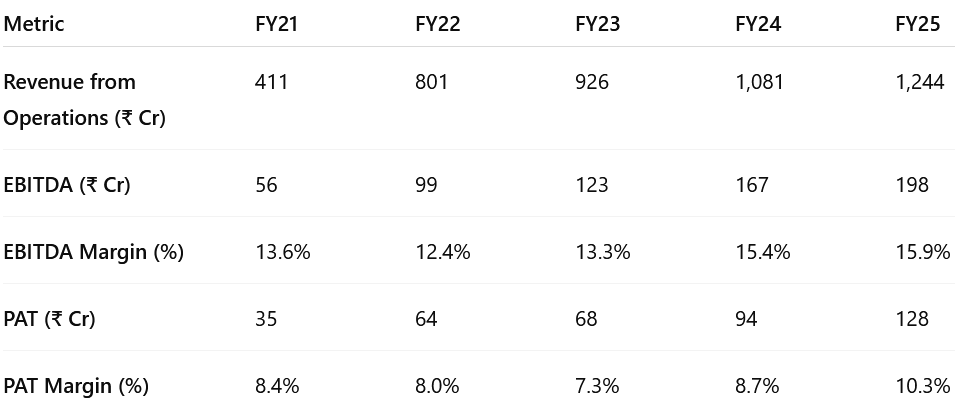
2. FY21-25: PAT CAGR 38% | Revenue CAGR 32%
2.1 What Changed Between FY21–25
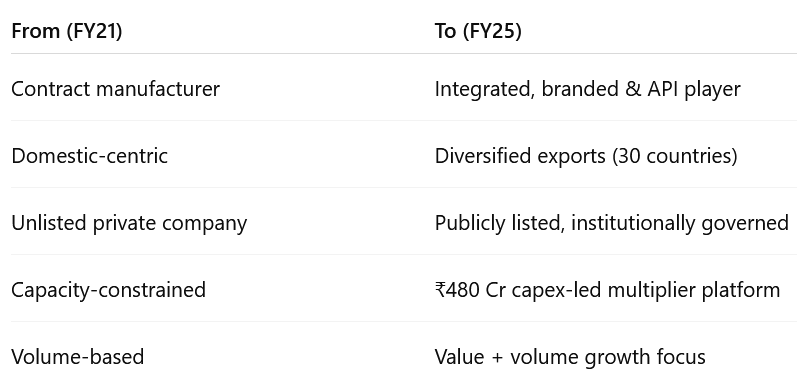
Revenue Growth: Driven by CDMO, domestic generics, exports, and Sharon acquisition
Margin Expansion: Operating leverage, better mix (branded generics, exports), & finance cost reduction
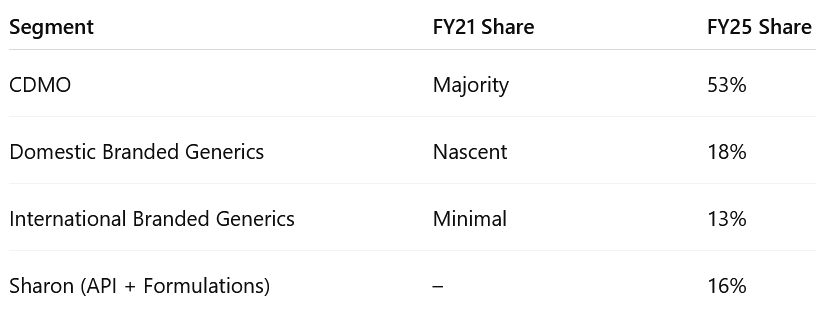
Diversified Revenue Mix
Strategic Expansion via Capex: New Jammu Plant (₹480 Cr capex)
Adds 15–20% capacity today; can scale to ₹1,200–1,500 Cr revenue at full tilt.
Benefits: 300% GST-linked incentives + 6% interest subvention.
3. Q4-25: PAT up 3% & Revenue up 20% YoY
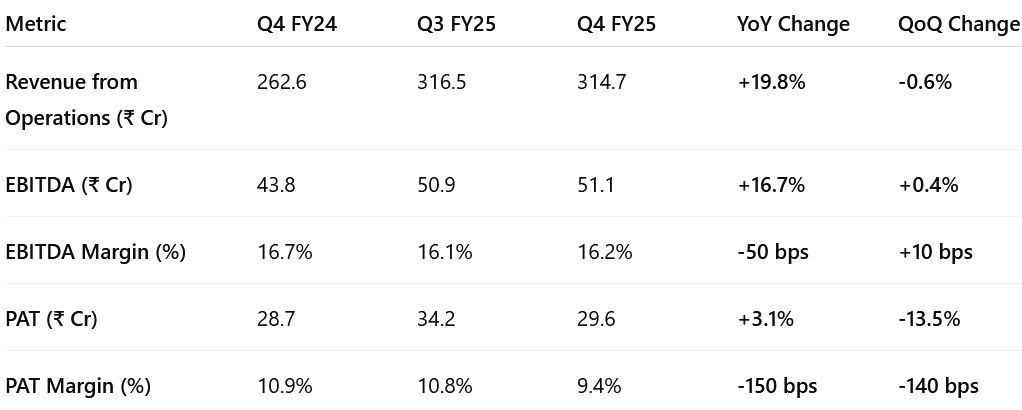
Revenue grew nearly 20% YoY, led by broad-based growth in all business segments.
EBITDA was stable QoQ, with margins improving slightly despite Jammu's early cost absorption.
PAT margins compressed as finance and depreciation costs rose post-plant commissioning.
4. FY25: PAT up 36% & Revenue up 15% YoY
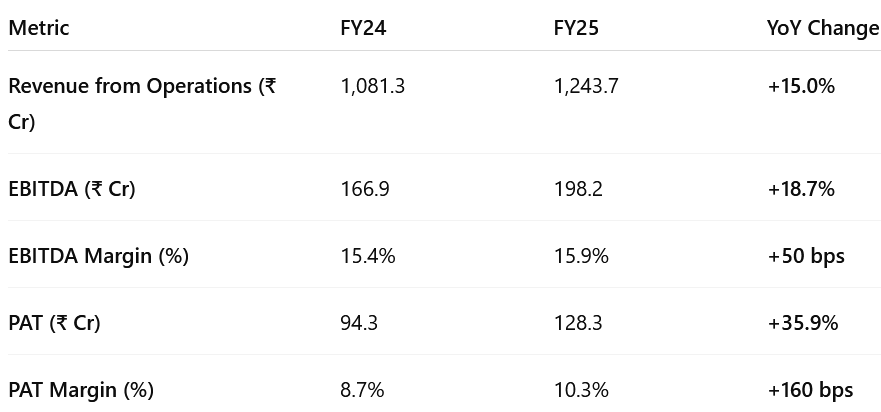
Top-line grew strongly at 15%, with gains across CDMO, domestic branded generics, and exports.
EBITDA growth outpaced revenue due to better mix and scale benefits.
PAT surged 36% on improved margins and sharp decline in finance costs (₹2.4 Cr vs ₹21.5 Cr in FY24).
Margin expansion: aided by better operating leverage and early benefits from Sharon integration and Jammu incentives.
5. Return Ratios: Declined Post Expansion
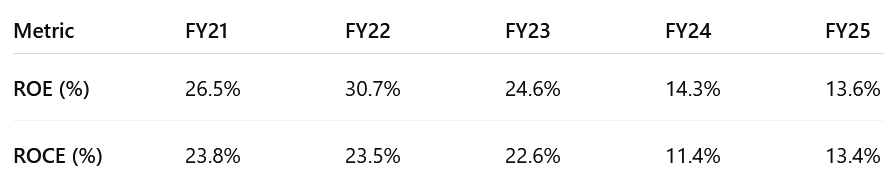
ROE/ROCE peaked in FY22, before contracting sharply due to:
Heavy capex in the Jammu greenfield plant (~₹480 Cr)
Equity base expansion post IPO (Dec ’23)
FY25 shows a mild recovery as operating leverage kicks in with new capacity.
6. Strong outlook: FY25-28 CAGR of 25%
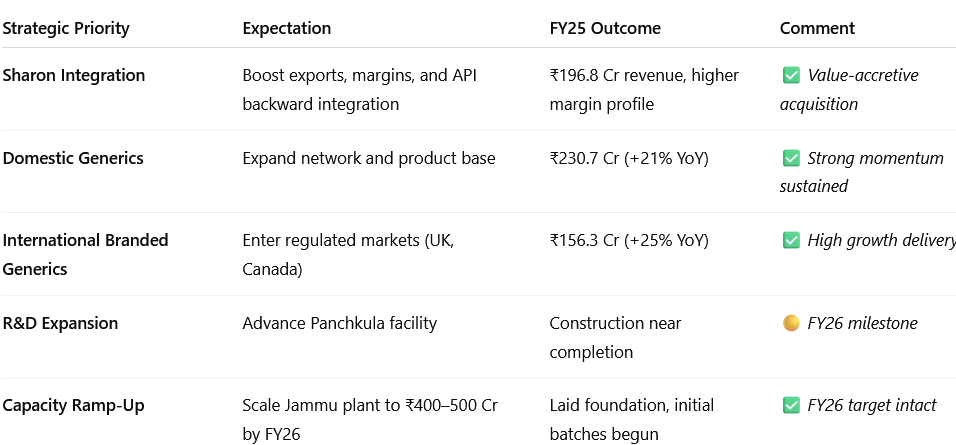
6.1 FY25 Expectations vs. Performance
Financial Performance
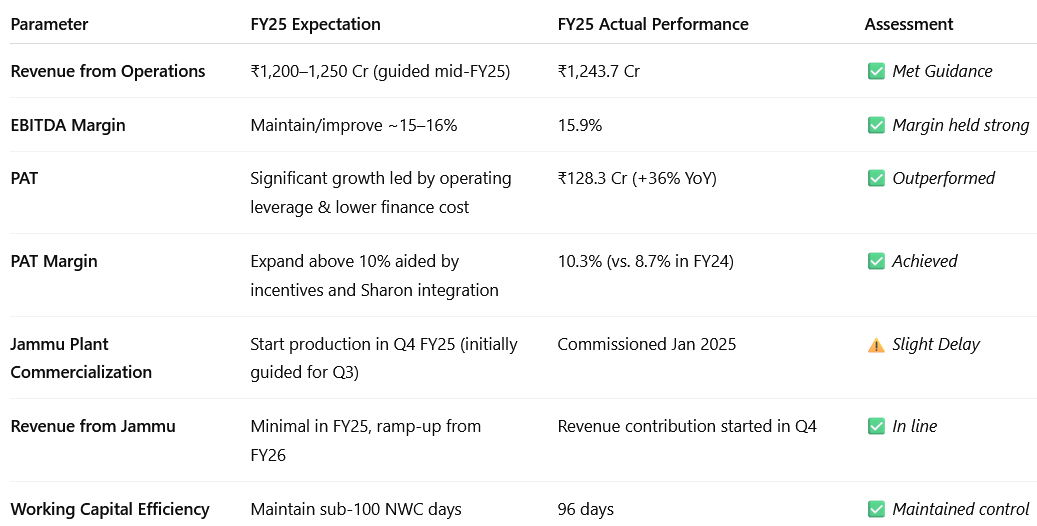
Strategic Deliverables vs. Execution
6.2 Innova Captab – Guidance & Outlook for FY26 and Beyond
A. FY26: Revenue Growth of 40%+
Based on 13% (low teens) growth in core (ex-Jammu) business ( ₹1,208 Cr) and incremental ₹400 Cr from Jammu facility implies a revenue of ₹1,765 Cr in FY26
So out of my INR1,244 crores, my non-Jammu was around INR1,208 crores.
We are maintaining that we should be growing in early teens for our existing facilities.
Plus, over and above the revenue that we'll get from Jammu plant.
Jammu plant is poised to achieve a revenue of around INR400 crores for this financial year FY'26.
B. FY25–28: Revenue CAGR of 25% with stable to improving margins
A revenue CAGR of 25% is assumed with stable margins, despite the potential upside from operating leverage and reduced finance costs driven by the 300% GST-linked incentives and 6% interest subvention under the Jammu investment scheme.
So, where we seek to over long term, we are very much confident that we should be maintaining the CAGR of 25% revenue growth over the next 3 years.
7. Valuation Analysis
7.1 Valuation Snapshot – Innova Captab Ltd
P/E (FY25 / FY26E / FY28E): 38.6× / 25.0× / ~12.0×
Current P/E of 38.6× reflects near-term optimism and embedded execution risk.
Forward P/E of ~25× for FY26 looks reasonable given >40% expected PAT growth.
Long-term P/E compresses to ~12× by FY28, assuming earnings compound at guided rates.
EV/EBITDA (FY25 / FY26E): ~24.9× / 16.8×
Based on FY26E EBITDA of ~₹295 Cr, assuming 16.7% margin on ₹1,765 Cr revenue
High absolute multiple today due to underutilized capacity, but expected to normalize rapidly
Incentive benefits (6% subvention + 300% GST-linked subsidy) will enhance cash flow conversion
ROE / ROCE (FY25): 13.6% / 13.4%
Capex drag (from Jammu plant) kept returns suppressed in FY25
ROCE to improve materially from FY26 as Jammu scales
Full benefit of margin leverage expected from FY27–28
Market Cap to Sales (FY25): ~3.97× (₹4,944 Cr / ₹1,244 Cr)
Premium vs peers today, but valuation multiple to compress with scale
FY26E: ~2.8× on ₹1,765 Cr revenue
Innova Captab is currently trading at premium FY25 multiples, but forward valuation is reasonable and improves rapidly if guided growth materializes. With EBITDA margins set to expand and high revenue visibility, the stock presents a high-growth, high-operating-leverage story.
7.2 What’s in the Price?
FY26 Revenue of ₹1,700–₹1,800 Cr:
The market appears to be pricing in 40% YoY topline growth, in line with management's ₹1,765 Cr guidance (₹400 Cr from Jammu + 13% from base business).EBITDA Margin of 16–17%:
Consensus expectations are aligned with management guidance. Margins factor in early-stage Jammu cost absorption and scale benefits.Initial Jammu Ramp-Up:
Contribution of ₹400 Cr revenue and early EBITDA-positive operations seem factored in, based on current EV/EBITDA and P/E multiples.Branded Generics & Export Growth:
Low-to-mid 20% growth in domestic branded and international generic businesses appears embedded, reflecting past execution consistency.Low Finance Cost (6% Subvention):
Interest savings from incentive-linked loans for Jammu are partially priced in, supporting higher PAT margins.FY25 PAT Growth Realization:
The ~36% YoY growth in FY25 PAT is now recognized by the market, driving the re-rating from 52-week lows.
7.3 What’s Not in the Price? (Potential Upside Triggers)
Full Ramp-Up of Jammu Plant (FY27–28):
Market prices in only ~30–35% utilization for FY26. Full potential of ₹1,200–1,500 Cr revenue from Jammu is not yet reflected.EBITDA Margin Expansion to 18%+:
Management sees potential for 18–19% margins post-FY26. The operating leverage benefit from full utilization is a clear upside lever.Exports to Regulated Markets (UK, Canada):
Regulated market traction is in early stages. Additional revenue from filings and approvals could re-rate earnings sharply.R&D-Led Premiumization:
Upcoming Panchkula R&D center could enable differentiated generics, enhancing both margins and product stickiness.Capital Efficiency Recovery:
ROCE remains suppressed post-capex. Recovery toward 18–20% by FY27–28 is not fully priced in and could drive valuation re-rating.EPS Expansion by FY28:
Street may be underestimating PAT compounding potential to ₹400+ Cr, translating to ₹70+ EPS, and compressing forward P/E below 12×.
8. Implications for Investors: What to Watch
8.1 Bull, Base & Bear Case Scenarios – Innova Captab
Bull Case: All levers fire together — full ramp-up at Jammu, robust branded & export growth, margin expansion, and capital efficiency rebound.
Revenue Growth: Driven by full capacity utilization across Jammu’s 4 blocks, 25%+ CAGR in branded generics and exports, and continued CDMO growth.
EBITDA Margin: 18–19%
Strong operating leverage, incentive flow-through, and improved product mix drive superior profitability.Exports: >35% of revenue
Regulated market filings scale up meaningfully in UK, Canada, and semi-regulated zones.R&D Commercialization:
Complex generics and differentiated dosage forms (e.g., BFS, respules) support premium pricing and margin uplift.Capital Allocation:
Free cash flow strengthens; limited need for debt. Optionality for dividends or bolt-on acquisitions opens up.
Base Case: Execution meets expectations, with conservative assumptions on ramp-up and margin realization.
Revenue Growth: ~25% CAGR, steady growth in core branded & export segments.
EBITDA Margin: 16.5–17%
Jammu becomes fully EBITDA-positive by FY26, but further margin expansion is gradual.Exports: ~30% of revenue
Steady scale in ROW and select regulated markets, margin-accretive product mix improves gradually.R&D Leverage:
Panchkula R&D center supports steady innovation, without major breakthroughs.Capital Allocation:
Strong internal accruals fund working capital and maintain net debt low. No equity dilution needed.
Bear Case: Ramp-up delays, margin expansion lags, or market/working capital risks emerge.
Revenue Growth: Less than 20% CAGR. Utilization at Jammu plateaus at 30–40%, branded generics face competition or regulatory delays.
EBITDA Margin: 15.0–15.5%. Fixed costs remain elevated, incentive realization delayed or below projections.
Exports: 25–28% of revenue. ROW growth sustains, but limited success in regulated market expansion.
R&D Impact: Limited contribution from complex generics or delayed monetization of R&D pipeline.
Capital Allocation: Working capital intensity rises, limiting free cash flow; reinvestment needs crowd out returns.
8.2 Key Risks & What to Monitor – Innova Captab
A. Execution Risk – Jammu Capacity Ramp-Up
FY26 is the first full year of commercialization at the Jammu facility. Any delay in achieving the targeted ₹400–500 Cr revenue or slower-than-expected utilization across the four new blocks could affect both topline and margin expansion.
Monitor: Block-wise ramp-up status, customer onboarding timelines, quarterly revenue contribution from Jammu, and production utilization updates.
B. Margin Risk from Business Mix
CDMO, branded generics, and exports have distinct margin profiles. While exports and branded products offer higher margins, any shift in revenue mix toward low-margin CDMO (or delay in premium product launches) could cap margin expansion.
Monitor: Segment-level mix, branded vs. CDMO share, realization trends, new product approvals (especially BFS, injectables), and raw material inflation.
C. Order Book & Regulated Market Visibility
Sustained growth in exports depends on conversion of the growing regulated market pipeline (UK, Canada, etc.). Approvals, audits, or regulatory delays could affect future export contribution and upside potential.
Monitor: Export dossier status, country-wise revenue split, regulated market progress updates, filings and approvals pipeline, and R&D output.
D. Working Capital & Cash Flow Risk
Receivables and inventory are expected to remain elevated due to ramp-up. If revenue scaling lags, or if incentive disbursements are delayed, free cash flow and return ratios could come under pressure.
Monitor: Inventory levels, receivable days, incentive realization timelines (GST & interest subvention), and working capital cycle disclosures.
E. Valuation Sensitivity
At ~25× FY26E P/E, the stock reflects ₹34–36 EPS. Any deviation from FY26 execution — particularly in Jammu ramp-up or margin improvement — could compress valuation multiples.
Monitor: Quarterly earnings delivery, margin trajectory, broker estimate revisions, and sector valuation trends.
F. Export & Policy Risks
With exports expected to contribute 30–35% of revenues over time, currency fluctuations, regulatory changes, or geopolitical tensions may affect volumes or realization.
Monitor: Export order pipeline, forex impact disclosures, trade policy changes (especially in the UK, Canada, MENA), and pricing pressure in generic formulations.
9. Margin of Safety for an Innova Captab Investor
A. Valuation Embeds Conservative Growth, Leaving Room for Upside
At ~25× FY26E P/E and ~16.8× EV/EBITDA, Innova Captab trades at forward multiples that assume steady execution — but not full potential ramp-up.
Current valuation assumes:
Revenue grows 40% in FY26 to ₹1,765 Cr, followed by a 25% CAGR till FY28, reaching ₹3,500 Cr at full scale
EBITDA margins stay stable at 16–17%, below management’s 18%+ medium-term aspiration
Jammu contributes ₹400–500 Cr in FY26, but only partially utilized
Valuation leaves room for re-rating if Innova delivers above expectations. The market prices in execution and scale-up, but not full margin recovery, R&D monetization, or exports optionality — offering a buffer.
B. Ramp-Up Projects Are Core to the Growth Thesis
The Jammu facility (₹480 Cr capex) is key to doubling revenue and improving blended margins over FY25–28.
Jammu is expected to contribute ₹1,200–1,500 Cr at full utilization
Blocks across Cephalosporin, BFS, Penicillin, Penum target higher-margin dosage forms
300% GST-linked incentive and 6% interest subvention drive margin and FCF upside
R&D centre at Panchkula can unlock future IP-driven premiumization
These are execution-led assets and central to the 25%+ CAGR roadmap. Any underutilization or incentive delay could shift earnings trajectory.
C. What’s Supporting the Downside?
Even if ramp-up is slower than projected, Innova Captab offers multiple buffers:
Undemanding long-term valuation: Forward PEG < 1 based on 40%+ EPS growth
Low interest burden: FY25 finance cost was ₹2.4 Cr (down 89% YoY), with further benefit expected in FY26
Strong recurring revenue base: 53%+ from CDMO + branded generics with 190+ clients
No equity dilution: Funded growth via IPO and low-cost debt; FY26–27 capex already behind
Optionality in exports: UK, Canada filings underway; upside not priced in
These factors don’t prevent volatility, but protect against structural downside or dilution risk.
9.1 Overall Margin of Safety: Moderate to High
Innova Captab offers a moderate-to-high margin of safety for long-term investors.
Current valuation reflects only:
FY26 execution + early Jammu scale
Base-case margin and PAT guidance
Upside optionality from exports, R&D, full Jammu ramp, and margin expansion is not fully priced in
This makes Innova a compelling compounder for investors with a 2–3 year horizon.
Execution remains key, but revenue scale, capital efficiency rebound, and valuation provide favorable risk-reward.
Previous coverage of INNOVACAP

Don’t like what you are reading? Will do better. Let us know at hi@moneymuscle.in
Don’t miss reading our Disclaimer
Very good analysis!
Thanks!!