
Indo Tech Transformers FY25 Results: PAT up 36%, CAPEX to Support Growth
Strong capacity expansion to support growth for FY27 and beyond supported by industry tailwinds. Premium valuations provide opportunity in the long term based on capex
1. Transformer Manufacturer
indo-tech.com | NSE: INDOTECH
ITL, incorporated in 1992, manufactures power and distribution transformers and various special application transformers and mobile sub-station transformers. The company’s manufacturing plants are in Chennai and Kancheepuram in Tamil Nadu. ITL is a subsidiary of Shirdi Sai Electricals Limited, and SSEL currently holds a 70.01% stake in ITL.
Products

2. FY21-25: PAT CAGR of 78% & Revenue CAGR of 32%

3. Q4-25: PAT down 18% & Revenue up 19% YoY
PAT up 9% & Revenue up 15% QoQ

4. FY25: PAT up 36% & Revenue up 23% YoY

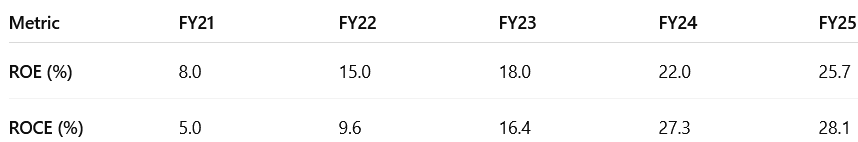
5. Business metrics: Strong & Improving return ratios
6. Strong outlook: Muted growth in FY26 to be followed by strong growth in FY27
6.1 FY25 Expectations vs Performance
✅ Hits – What Worked Well in FY25
Strong Revenue Growth: Driven by healthy demand and improved execution
PAT Growth: PAT Margin expanded from 9.2% to 10.2%
Capital Efficiency: Strong return ratios supported by asset-light operations and strong margin control
Robust Working Capital Improvement
Working capital cycle improved to 129 days (from 152)
Debtor and inventory days reduced significantly
Net Cash Position
Strong cash flows helped maintain a net cash balance and reduce borrowings
Capex funded entirely through internal accruals
❌ Misses – Where It Fell Short
EBITDA Margin Compression
EBITDA Margin declined from 12.9% in FY24 to 12.2% in FY25
Despite revenue growth, raw material cost inflation pressured margins
Exports Muted:
Export contribution at 0.32% of revenue (vs 4.31% in FY24)
Limited Operating Leverage
EBITDA grew only 15.9%, lower than the 23.2% revenue growth
Indicates some margin dilution from execution mix or fixed-price contracts
Order Book Moderation
Book-to-bill ratio at 1.46x of FY25 revenue
Decent, but signals moderation compared to high-growth peers
6.2 Future Outlook for Indo Tech Transformers (ITL)
Revenue & Growth Visibility
Growth in FY26 to be muted by capacity constraints
Utilisation: Improved from 48% in FY23 → 75% in FY24 → 88% in FY25.

Order Book: ₹8,827.4 million (as of April 30, 2025), equivalent to 1.46x FY25 revenue — providing strong revenue visibility up for FY26.
Growth will be driven by:
Execution of the current order book
Planned capacity addition of 2,500 MVA by FY27
Robust demand from domestic infra and energy sectors
Profitability & Margins
Margins are expected to remain healthy (10%–13%) despite raw material price volatility, due to:
Scale-led operating leverage
Price-lock strategies on key raw materials (CRGO steel and copper)
Orders have price escalation clauses one can assume the margins to be sustainable.
~50% of the order mix includes a price variation clause, which mitigates the risk to some extent
Balance Sheet & Leverage
Capex Plan: Expand capacity, fully funded by internal accruals
Comfortable leverage and interest coverage are likely to improve further, backed by:
Absence of debt-funded expansion
Strong internal accruals
Modest repayment obligations (~₹3 Cr annually)
Industry tailwinds creating strong demand
Transformer industry is flushed with orders and the demand outlook is positive vis-a-vis end use in various industries such as railways and renewables. The pent-up demand from industrial expansions backed by a rise in capex is leading to higher consumption of power in India, in turn leading to improved order books for transformer manufacturers.
We remain confident of sustaining the market share and maintaining margins at healthy levels.
Challenges to Tackle
Raw Material Price Volatility: 59% of contracts were fixed-price in FY25
Working Capital Intensity: Still structurally high due to advance supplier payments
Order Book Concentration: Government orders are low (~7.5%) — private sector dependence could pose cyclicality risks
Overall Outlook
Indo Tech Transformers is well-positioned for sustained growth with:
Visible revenue pipeline (1.46x book-to-bill)
Capacity-led volume upside
Strong profitability
Comfortable balance sheet
7. Valuation Analysis
7.1 Valuation Snapshot (FY25)

Valuation Demands Strong Execution
A P/E of 31.6x and EV/EBITDA of 25.6x suggest the stock is not cheap, but supported by:
10%+ PAT margins
ROCE of 28.1% and ROE of 25.7%
Clean balance sheet with net cash of ₹594 Cr
Low FCF Yield = Growth is Priced In
The FCF yield of 1.96% reflects:
Ongoing working capital requirements (129-day cycle)
Preference for internal funding of capex (₹70 Cr by FY27)
Market expectation that current free cash flows will scale meaningfully in coming years
The low yield isn’t necessarily a red flag — it reflects a business in growth mode with high reinvestment and capital efficiency.
7.2 What’s in the Price?
Market is factoring in strong fundamentals and a visible near-term growth trajectory.
Muted growth in FY26 followed by Strong Revenue in FY26
Margin and Efficiency Expansion
Operating leverage to kick in as capacity is closer to 100%
Capital-Efficient Business
ROCE at 28.1%, ROE at 25.7%
Asset-light model: Capacity ramping without leverage
Net Cash Balance Sheet
Net cash of ₹407.9 Cr (Cash: ₹710.8 Cr – Debt: ₹302.9 Cr).
Free cash flow of ₹39.6 Cr, up despite higher capex.
Robust Order Book
Order book of ₹882.7 Cr (~1.46x FY25 revenue) gives good revenue visibility through FY26.
7.3 What’s Not in the Price?
1. Capacity Expansion Coming in FY27
₹70 Cr capex to add 2,500 MVA capacity by FY27 — no debt funding required, enabling future revenue/margin upside without equity dilution.
2. Exports – Immense Room to Grow
Export contribution fell to 0.32% of FY25 revenue (from 4.3% in FY24).
Management has indicated interest in expanding overseas — even a modest uptick could lift growth and margin profiles.
3. Operating Leverage Ahead
Fixed cost base relatively stable — scale-up from new capacity could deliver meaningful EBITDA margin expansion.
4. Working Capital Efficiency Still Untapped
FY25 WC cycle improved from 152 to 129 days, but inventory (76 days) and debtor levels (112 days) remain high.
Further reduction could unlock higher free cash flow conversion.
5. Limited Government Exposure
Only 7.5% of the order book is from government contracts — higher mix in future could improve collection cycles and order stability.
7.4 Risks and What to Monitor
Raw Material Volatility
59% of revenue came from fixed-price contracts in FY25 (vs. 52% in FY24).
Exposure to CRGO steel and copper remains significant (~65–70% of RM costs).
While proactive procurement mitigates some risk, price shocks can dent margins.
Working Capital Drag
Despite improvement, the WC cycle remains elevated:
Debtor days: 112
Inventory days: 76
Creditor days: just 59 → limited supplier credit
This creates ongoing stress on operating cash flows.
High Valuation Multiples
EV/EBITDA of 25.6x leaves little margin for error — any earnings miss could lead to de-rating.
Capex Execution Risk
FY27 capex (₹70 Cr) is fully internally funded, but execution delays or cost overruns could impact operating leverage timelines.
Sectoral Cyclicality
Industry is prone to capex cycles — prolonged slowdown in T&D investments may hurt order inflow.
8. Implications for Investors
8.1 Bull, Base & Bear Scenarios — Indo Tech Transformers
Bull Case (Probability: Moderate)
Faster conversion of ₹882.7 Cr order book
Exports bounce back from FY25 lows (0.3% of revenue)
Raw material prices (copper, CRGO) remain benign or decline
Working capital cycle tightens further from 129 days
Realisations improve beyond ₹0.739 million/MVA
Base Case (Probability: High)
Order execution continues steadily through FY27
Margins stay within 12–13% band
Working capital days remain stable (120–130 days)
Capex of ₹70 Cr for 2,500 MVA expansion completes on schedule by FY27
Export contribution remains low but consistent
Bear Case (Probability: Low)
Execution delays push back part of order book beyond FY27
Raw material prices rise sharply (copper, CRGO)
Export revival fails to materialise
Working capital cycle stretches due to delayed receivables- Fixed-price contracts dominate order mix (margin pressure)
8.2 Is There Any Margin of Safety?
✅ Where There Is Margin of Safety
Business Model Strength
Pure-play transformer manufacturer with no commodity exposure (unlike cables/conductors).
Strong pricing discipline: Realisation improved to ₹0.739 Mn/MVA in FY25 with 59% fixed-price contracts, enabling predictability.
High-margin structure: PAT margin of 10.2% in FY25; EBITDA margin of 12.2%.
Zero dependence on exports: Domestic order book (₹882.7 Cr as of April 2025) shields against currency and global shocks.
Capital Structure
Net cash position: ₹594 Cr in cash vs ₹303 Cr in total debt → zero net leverage.
FCF strength: ₹409.95 Mn free cash flow in FY25 supports future growth without dilution or borrowing.
Internal accruals to fund capex: ₹70 Cr expansion planned through FY27, fully funded from profits.
Execution Strength and Visibility
Order book provides 1.46x revenue visibility into FY26–FY27.
Capacity utilisation at 88% in FY25, up from 48% in FY23 — no meaningful expansion until FY27 but strong operating leverage remains.
Inventory and debtor days falling: Working capital cycle dropped from 152 days (FY24) to 129 days (FY25).
Valuation Support
P/E of 31.6x looks optically high, but reflects zero-debt, consistent earnings growth and niche industrial focus.
EV/EBITDA at 11.8x remains reasonable given 28.1% ROCE and strong cash profile.
FCF yield of 2.0% (FY25 FCF of ₹40 Cr on ₹2,017 Cr market cap) may look modest but adds valuation discipline.
❌ Where There Isn’t Much Margin of Safety
Valuation Relies on Continued Execution
FY25 earnings priced in — slippage on execution (e.g., debtor cycle elongation, raw material inflation, lower order conversion) could compress multiples.
No room for execution delays or margin pressure: Market is already assigning a premium for "steady compounding."
Execution Risks Remain
Fixed-price contract mix rose to 59% — if RM prices spike, margins may compress.
No capacity addition until FY27 — limits revenue growth unless realisations improve further.
Export revival hasn’t materialized — only 0.3% of FY25 revenue.
Concentration risk in transformer segment — unlike diversified industrial peers, ITL is not hedged by product mix.
Conclusion:
Indo Tech’s FY25 execution has been strong — high ROCE, clean balance sheet, and strong FCF — but valuation support now hinges on near-flawless execution through FY27.
The margin of safety exists in its capital structure and order book visibility — but not in price if growth stalls or costs rise unexpectedly.
Previous coverage of INDOTECH

Don’t like what you are reading? Will do better. Let us know at hi@moneymuscle.in
Don’t miss reading our Disclaimer