
Indian Bank Q4 FY25 Results: Profit Up 36%, Best-in-Class Asset Quality, ROE Crosses 20%
Indian Bank FY25: Profit up 35%, RoE 20.8%, GNPA 3.1%. FY26 guides for 10–12% credit growth. At 7.4x P/E, 1.36x P/B, valuations remain low despite strong metrics.
Bank stocks seem complex — until you know where to look. Learn how to read CASA, NIM, and PCR like seasoned investors in this simple, practical guide.

1. 5-Year Financial Performance (FY21–FY25): Scale, Profitability, and Risk Control
1.1 Loan Book Growth: Broad-Based Expansion Led by RAM Segments

Loan growth has been consistent and broad-based, driven by RAM segments which now account for over 64% of domestic credit.
1.2 Earnings Momentum: NII Doubles, Net Profit Grows at 37% CAGR
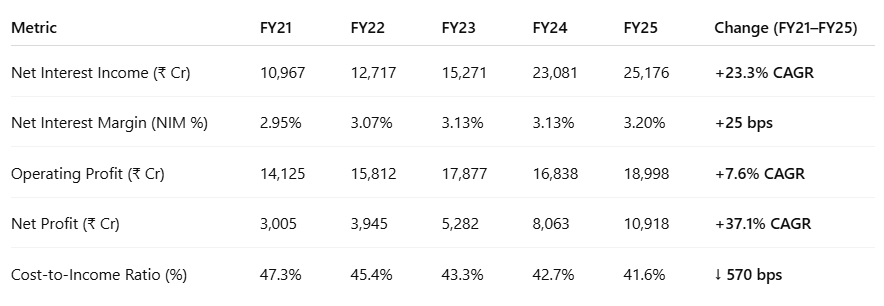
Net Interest Income has more than doubled in 5 years, supported by a shift toward RAM segments and improved yield mix.
Net Profit has compounded at 37% annually — reflecting rising margins, stable slippages, and treasury tailwinds.
Cost-to-Income Ratio declined steadily, signaling better tech-driven operating efficiency and scale benefits.
1.3 Asset Quality Transformation: Net NPA Near Zero, PCR at 98.1%

Asset quality metrics improved sharply. GNPA fell by over 500 bps, while PCR moved above 98%, indicating a conservative risk posture and robust recovery efforts. The institution is now operating with one of the cleanest books in the industry.
2. Q4 FY25 Highlights: Profit Jumps 32%, Cleanest Balance Sheet Among PSUs
Indian Bank ended FY25 on a high note, delivering a strong Q4 performance led by double-digit profit growth, continued asset quality improvement, and sustained return ratios above 20%. The quarter capped off a transformational year for the bank — reinforcing its position as one of the best-run PSU banks in the country.
2.1 Profit & Margin Snapshot: Operating Leverage Drives Strong Bottom Line

Profit growth was driven by higher interest income, stable operating costs, and better treasury performance.
Operating leverage was visible as core pre-provision profits grew faster than NII.
2.2 Asset Quality: PSU Leader With Near-Zero Net NPA
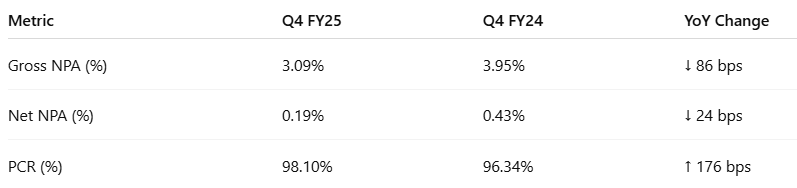
Indian Bank now has one of the cleanest PSU loan books, with near-zero net NPAs.
Provisioning coverage continues to strengthen — acting as a robust buffer.
2.3 Balance Sheet Trends: Retail Credit and CASA Improve Sequentially

Growth was broad-based, led by RAM segments.
Domestic CASA improved QoQ, helping support margins.
3. Full-Year FY25 Results: Robust Growth in Profit, Credit, and Return Metrics
3.1 PAT Crosses ₹10,000 Cr; RoA and RoE Hit All-Time Highs

Net profit crossed ₹10,000 Cr for the first time — up 3.6x from FY21
RoA and RoE continued expanding, confirming the bank’s capital productivity and low credit cost base
3.2 Advances & Deposits: RAM Segments Power 10.2% Loan Growth

Loan growth was led by retail (+13.7%), agri (+13.7%), and MSME (+11.9%)
CASA moderated due to tighter liquidity, but CD ratio improved, showing better capital deployment
3.3 Risk Metrics: Highest PCR Among Peers, Slippages Remain Low

Net NPA is now near-zero — outperforming most PSU and mid-tier private banks
PCR at 98.1% provides a strong cushion against future stress
4. Return Ratios & Efficiency: Why Indian Bank Looks Like a Private Lender
RoE crossed 20% in FY25 — a top-tier achievement among PSU banks

NIMs have remained stable to positive, inching up by ~25 bps over 5 years — supported by higher RAM mix and digital disbursals.
ROA improved from 0.50% to 1.32% — a 3x uplift, indicating capital-efficient growth and lower credit costs.
ROE crossed 20% in FY25 — putting Indian Bank at par with top-performing private banks and well above PSU averages.
Cost-to-income ratio fell steadily, now near 41% — reflecting operating leverage from digitization and controlled expense growth.
FY25’s metrics reflect a structurally profitable bank with consistent return improvements, not a cyclical bounce.
The bank is now delivering private-bank-level metrics while still trading at PSU-level valuations.
5. FY26 Strategic Roadmap: Focus on Digital, RAM Credit, and CASA Granularity
Stable leadership, focused execution, and digital acceleration define the bank’s next growth phase
Indian Bank’s management struck a confident, measured tone in its FY25 commentary — highlighting strong execution, balance sheet strength, and a clear plan for FY26. The roadmap emphasizes quality growth, digital-led efficiency, and steady improvements in return ratios.
5.1 FY26 Guidance: Growth With Capital Efficiency

Guidance reflects a quality-over-quantity growth mindset, with a focus on capital efficiency and credit discipline.
5.2 Key Strategic Priorities: Digital Disbursals, Fintech, and CASA Deepening
1. Expand RAM Lending
Push Retail, Agri, and MSME loans beyond 65% of the loan book
Drive pre-approved and digital-first personal, home, and MSME credit journeys
Focus on secured, high-margin portfolios
2. Strengthen Digital Ecosystem
Double digital disbursals via mobile/internet banking
Expand partnerships with fintechs (167+ empanelled)
Launch end-to-end digital journeys for gold, auto, personal loans
3. Improve CASA & Liability Granularity
Build segment-based CASA products
Focus on SME & government salary accounts
Drive transaction-led acquisition in rural/semi-urban centers
4. Maintain Asset Quality & Risk Controls
Early-warning systems and analytics-led credit monitoring
Maintain slippages below 1.1%
Continue high provisioning coverage (>98%)
5. Sharpen Operating Leverage
Optimize branch productivity and tech investments
Cost-to-income target: <41%
Rationalize back-end operations through shared service models
5.3 Long-Term Vision (FY27–FY30): High-RoA, High-Trust Digital PSU Franchise
“We aim to make Indian Bank a digitally-enabled, high-RoA, high-trust PSU franchise with strong retail and SME roots.” — Management
Structural RoA above 1.3%
Digital disbursals to form majority of new loan sourcing
Expand market share in personal & home loan segments
Maintain top-tier PSU rank in asset quality, return metrics, and digital adoption
5.4 Management Tone: Grounded, Consistent, Confident
No over-ambitious targets — emphasis on execution and sustainability
Management acknowledged PSU constraints, but focused on factors they can control
Digital partnerships, provisioning strength, and return ratios seen as key levers for long-term compounding
"In a world chasing flashy growth, we’re delivering stable, compounding returns — powered by clean books and digital agility."
— MD & CEO, Indian Bank
6. Valuation Analysis: Value Despite Best-in-Class Returns
6.1 Current Valuation Snapshot: P/E 7.4x | P/B 1.4x | ROE 20.8%

6.2 What’s Priced In: PAT Growth, Clean Book, Digital Push
Clean balance sheet: GNPA at 3.09%, Net NPA at 0.19%, PCR at 98.1%
Strong FY25 earnings: 35.4% PAT growth, EPS of ₹81.06
Sustainable RoE >20%: Three consecutive years of profitability expansion
Steady Growth in Advances: Loan book growth of 10.2% in FY25, led by RAM (Retail, Agri, MSME) segments, is seen as sustainable.
Digitization initiatives: Market has begun to recognize digital push via fintech partnerships and UPI scale-up
The stock has re-rated meaningfully over the past 12–18 months, moving from deep discount zone to a fair-value narrative — but upside remains.
6.3 What’s Not Fully Priced In: Re-Rating, EPS Compounding, Digital Monetization
Re-rating potential to private bank multiples: Still trades at 1.4x P/B vs 2.5–3x for comparable RoEs
Medium-term EPS compounding: FY26–FY28 visibility for ₹100+ EPS isn't in consensus estimates
Digital monetization optionality: No value assigned yet to scalable digital journeys or fintech integrations
Dividend story: Strong and improving payout capacity with CET-1 >15% isn’t priced into yield-seeking investor interest
Market remains hesitant to price Indian Bank like a structural compounder — still treating it as a “cyclical PSU story”.
6.4 Why Isn’t It Priced Like a Private Bank? Breaking Down the Discount
Despite return ratios comparable to mid-tier private banks (Federal, City Union, IDFC First), Indian Bank continues to trade at a 40–50% valuation discount. Why?
PSU Overhang: Government holding of ~73.8% and perception of limited autonomy dampen institutional appetite
Reputation Lag: Still associated with legacy inefficiencies of PSU banks despite transformation
CASA and Margin Sensitivity: Slightly lower CASA base makes investors cautious on NIM sustainability
Treasury Contribution: Some street skepticism on earnings repeatability due to G-sec gains in FY25
Yet, if Indian Bank maintains RoA >1.3% and RoE >20%, a re-rating to even 9–10x P/E and 1.8–2x P/B is not just possible — it’s rational.
Indian Bank’s numbers look private, but its valuation is still public-sector. That delta is the opportunity.
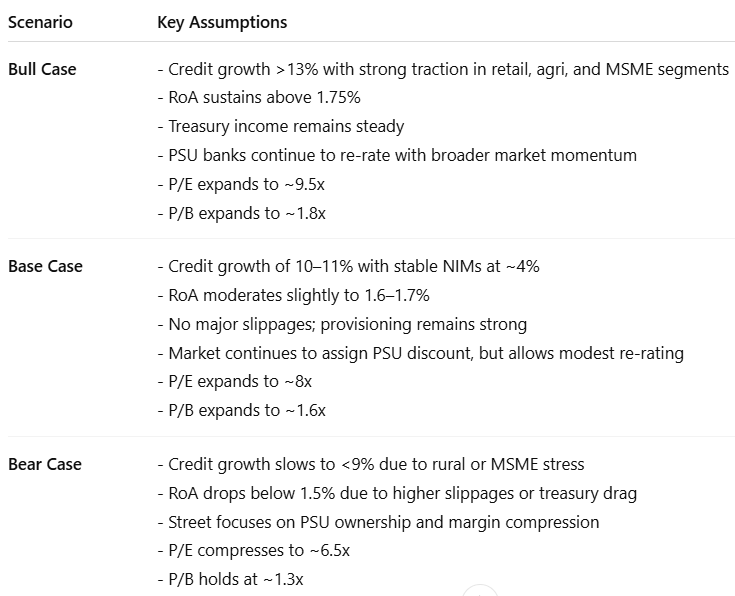
7. Implications for Investors: Risk-Reward Outlook for FY26
7.1 Bull, Bear, Base Case: Scenario Framework for FY26
7.2 Why You Should Stay Invested: Returns, Balance Sheet, and Optionality
A. Top-Tier Return Metrics
Return on Equity (RoE) at 20.76% and Return on Assets (RoA) at 1.32% in FY25 — consistently sustained at private-bank levels.
These return ratios are not cyclical spikes, but a result of structural improvements in lending mix, provisioning efficiency, and digital scale.
B. Valuation Still Doesn’t Reflect Quality
Trades at just 7.36x P/E and 1.36x P/B, despite outperforming many private banks on profitability and risk control.
Even with a ~1,100% return over 5 years, Indian Bank is still not priced for its RoE profile.
There’s meaningful scope for re-rating if market perception shifts from "PSU discount" to "compounding franchise."
C. Cleanest PSU Balance Sheet
Net NPA at 0.19%, Gross NPA at 3.09%, and PCR at 98.1% — places it well ahead of both PSU and several mid-sized private peers.
Risk-adjusted return metrics have improved dramatically with slippage control and proactive provisioning.
D. Strong, Broad-Based Loan Growth
FY25 credit growth of 10.2%, led by Retail (+13.7%), Agri (+13.7%), and MSME (+11.9%).
RAM share now >64.3%, enhancing yield and reducing credit concentration risk.
E. Operating Efficiency Gaining Momentum
Cost-to-Income ratio improved to 41.6% in FY25 — supported by digital initiatives, operating leverage, and process optimization.
Over 93% of customer transactions are digital — improving scale, lowering costs, and enhancing customer stickiness.
F. Strong Capital Position & Dividend Headroom
Healthy capital adequacy provides optionality for higher dividends or aggressive retail growth.
Dividend yield of 2.08% and improving earnings capacity could lead to more shareholder-friendly payouts.
G. Secular Re-Rating Tailwinds for PSU Banks
As PSU banks de-risk, digitize, and deliver returns >15–20%, investor perception is shifting.
Indian Bank, with its private-bank-like delivery, could benefit disproportionately from any structural sector re-rating.
7.3 Key Risks: Credit, Margins, Execution & PSU Overhang
A. Macroeconomic or Rural Credit Stress
A monsoon failure, inflation shocks, or agri-policy volatility could lead to stress in rural and MSME loan books, which form a significant part of Indian Bank’s RAM portfolio.
Credit cost could spike if slippages in these segments rise above trend levels, putting pressure on RoA.
B. Treasury & Yield Curve Risk
Indian Bank has historically benefitted from treasury gains. In a volatile or inverted yield environment, this could turn into a drag, especially if mark-to-market losses rise.
A sharp uptick in bond yields may weigh on other income and offset operating gains.
C. CASA Compression
CASA ratio dropped ~187 bps YoY in FY25 to ~40.2%.
Further erosion, especially in a high-rate environment, could pressure cost of funds and impact NIMs — especially if competition from private banks and fintechs intensifies.
D. Market Sentiment Around PSU Tag
Despite clean fundamentals, the market may continue to apply a valuation discount due to public ownership, political oversight, and perception of slower decision-making.
This “PSU drag” could limit re-rating even if earnings execution remains strong.
E. Execution Risk on Strategic Priorities
FY26 guidance depends on successful execution of digital sourcing, fintech partnerships, and liability franchise deepening.
Delays or underperformance in these areas could make operating metrics plateau, limiting upside.
F. Regulatory or Policy Shocks
Any unexpected policy changes in public sector bank dividend distribution, capital allocation, or provisioning norms could disrupt investor expectations.
Sector-wide PSU reforms — such as bank mergers or disinvestment — could create near-term volatility.
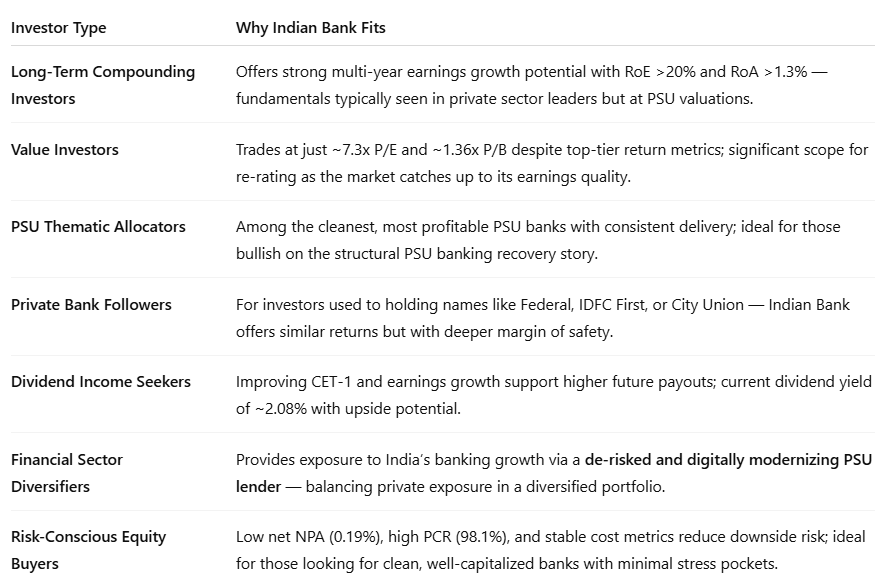
7.4 Who Should Buy Indian Bank: Ideal Investor Profiles
Bank of India is no longer a turnaround story — it's now a structurally profitable, capital-efficient PSU franchise that still trades at deep value multiples.
Don’t like what you are reading? Will do better. Let us know at hi@moneymuscle.in
Don’t miss reading our Disclaimer