
India Shelter Finance Q4 FY25 Results: PAT up 54%, 30% AUM Growth Target by FY30
India Shelter combines strong RoA with stable asset quality & digital execution. Despite rich valuations, earnings and AUM could scale meaningfully by FY30.

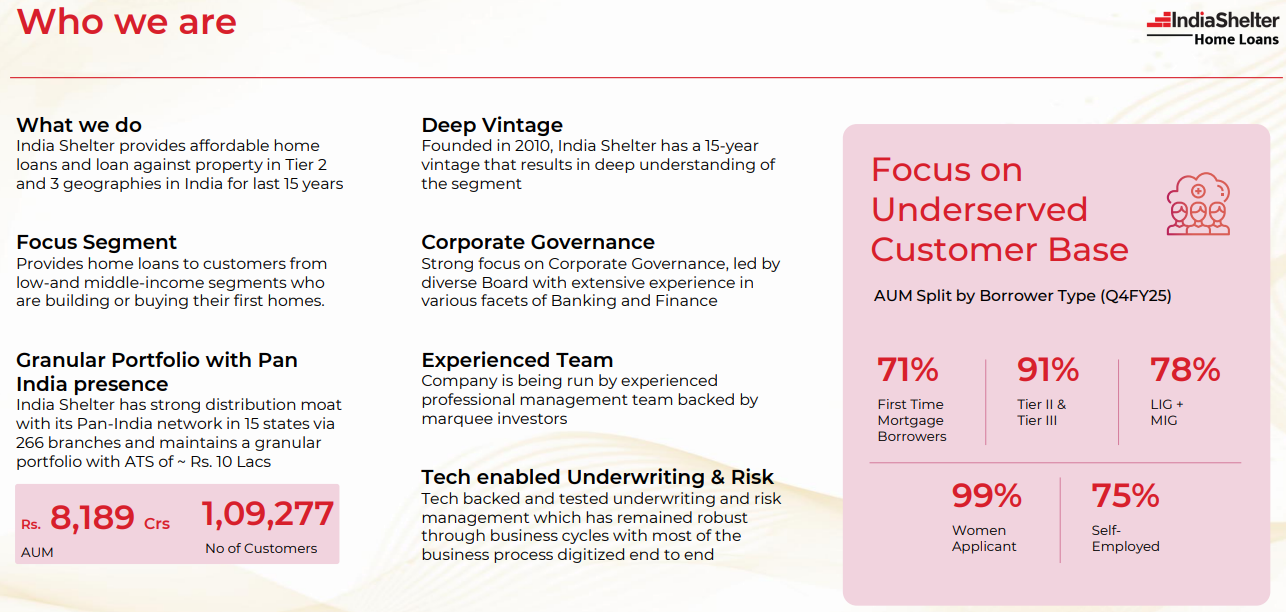
1. Affordable Housing Loans & Loan Against Property (LAP)
indiashelter.in | NSE: INDIASHLTR
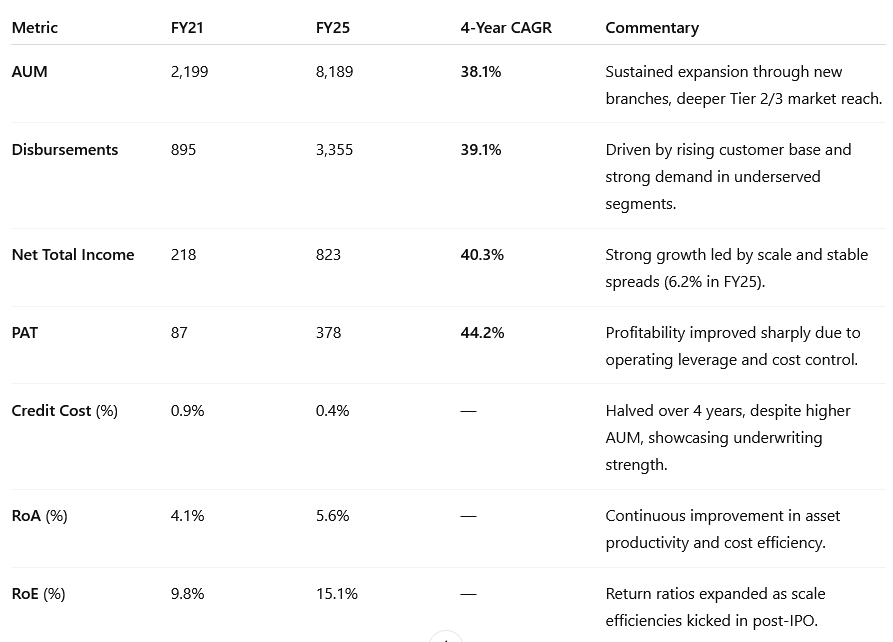
2. FY21-25: PAT CAGR of 44% & Total Income CAGR of 40%
India Shelter's FY21–FY25 performance reflects a high-quality growth story with superior earnings momentum, prudent risk management, and scalable operations.
2.1 Key Financial Metrics (₹ Cr): AUM, PAT, Total Income Trends
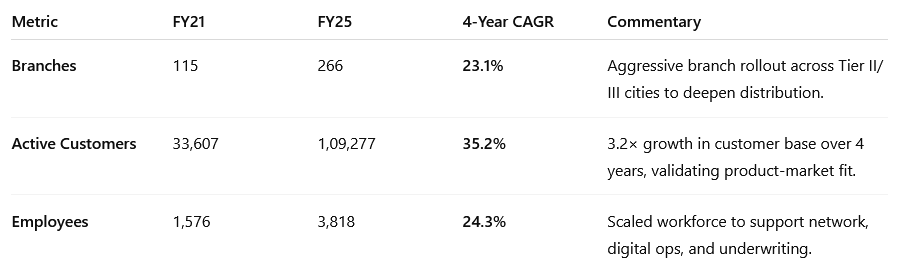
2.2 Operational Growth: Branch Network, Customer Base, Employee Scale-Up
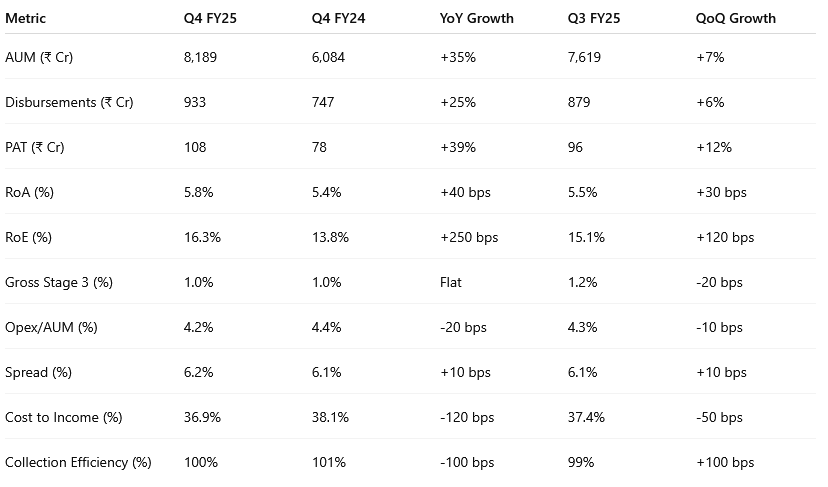
3. Q4-25: PAT up 39% & Total Income up 34% YoY
India Shelter maintained healthy momentum in Q4 with strong earnings growth, margin expansion, and operating efficiency gains. Asset quality remained stable despite a larger book.
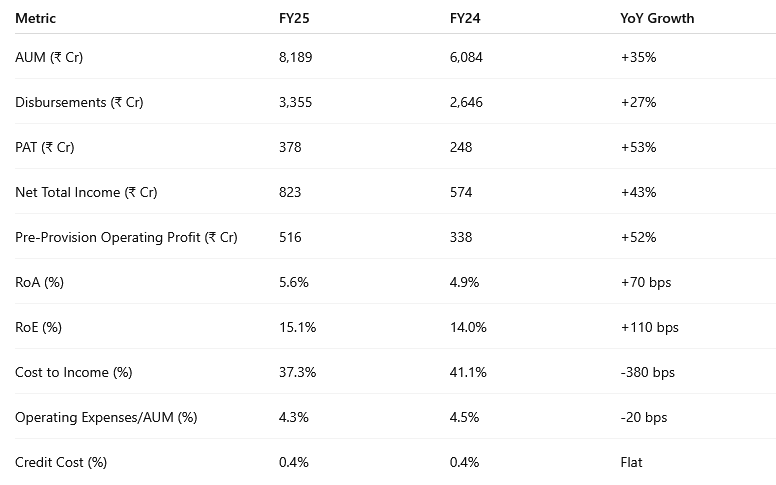
4. FY25: PAT up 53% & Total Income up 37% YoY
FY25 marked a breakout year for India Shelter, with >50% PAT growth and operating leverage playing out. Profitability improved due to rising scale, stable credit costs, and a 10 bps improvement in spreads to 6.2%.
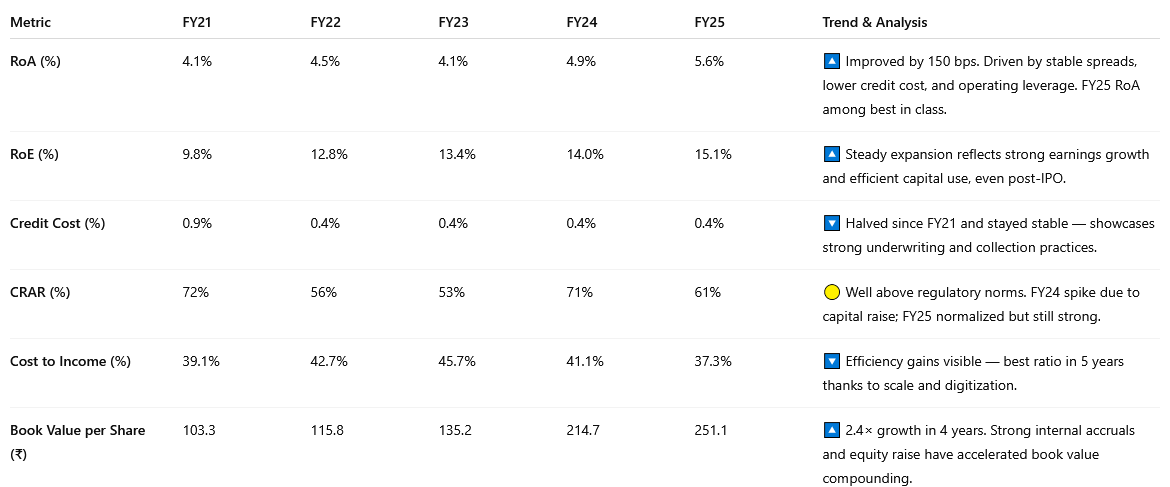
5. Profitability Metrics: Scaling with Stable RoA, RoE and Low Credit Cost
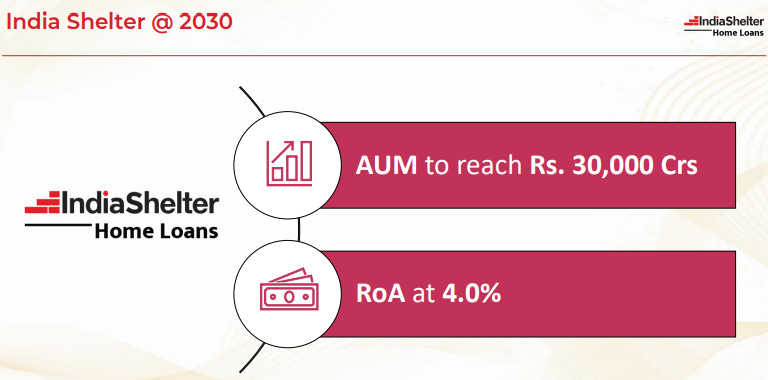
6. FY30 Vision: Rs 30,000 Cr AUM Target & 4% RoA Outlook
6.1 Management Commentary: Execution Focus, Financial Inclusion, ESG
The company emphasized its commitment to:
Scalable, branch-led growth across Tier II & III markets
Maintaining high return ratios post-IPO (RoA of 5.6%, RoE of 15.1%)
Expanding responsibly while keeping credit cost low (0.4%)
Strengthening ESG practices to enhance long-term resilience
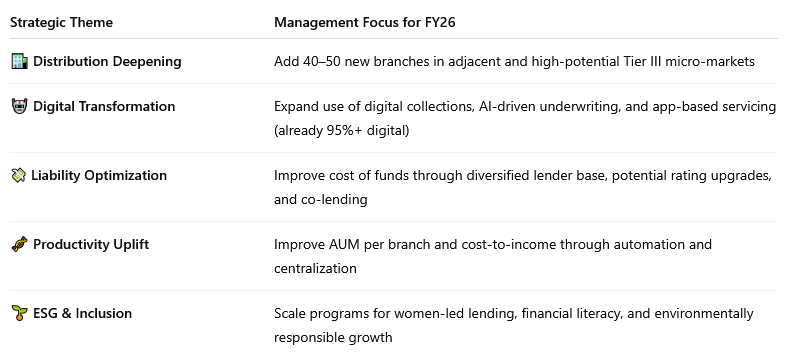
6.2 FY26 Business Strategy: Growth, Digitization, Liability Mix
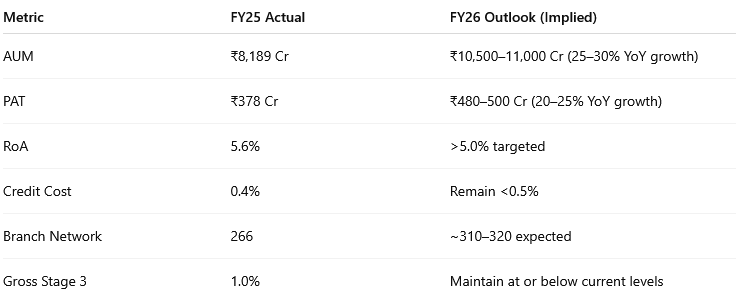
6.3 FY26 Operating Targets (Directionally Implied)
6.4 Long-Term Goals: ₹30K Cr AUM, ₹1,200 Cr PAT, Sustainable RoA
The FY26 roadmap is aligned with India Shelter’s 2030 goals:
Scale AUM to ₹30,000 Cr
Maintain RoA at or above 4%
Deliver PAT of ₹1,200 Cr+
Build a durable, tech-led NBFC with best-in-class return ratios
FY26 is a critical bridge year — balancing growth, profitability, and infrastructure for long-term compounding.
i. AUM Growth Outlook: 28.8% CAGR Required to Hit ₹30K Cr
Target to reach AUM of Rs 30,000 cr implies a CAGR of 28.8% from the FY25 AUM of Rs 8189 cr
We guided for an AUM growth of 30% to 35% for the next few years and continue to grow as per the plan.
ii. PAT Growth Outlook: 26% CAGR to Reach ₹1,200 Cr by FY30
ROA of 4% on an AUM of Rs 30,000 cr implies a FY25 PAT of Rs 1,200 cr. This a CAGR of 30% from the FY25 PAT of Rs 378 cr
7. Valuation Analysis: Are Premium Multiples Justified?
7.1 Key Valuation Multiples: P/E, P/B vs Fundamentals
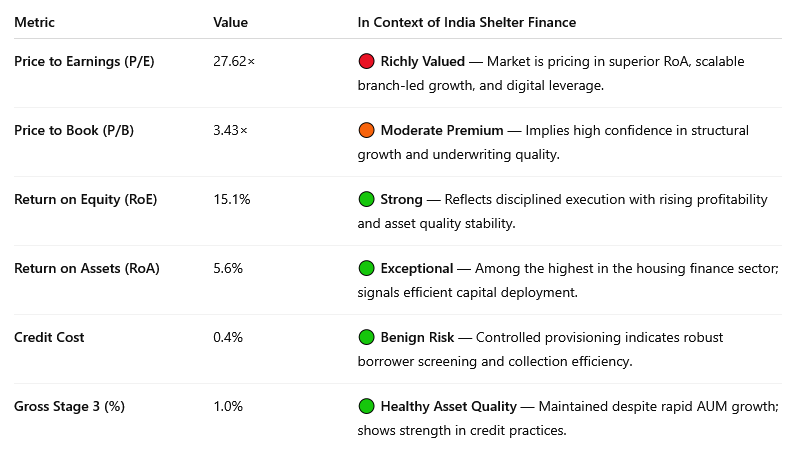
India Shelter trades at ~27.6× FY25 earnings and ~3.4× book value — a valuation that implies strong growth expectations and superior return metrics versus peers in the affordable housing finance segment.
7.2 What’s Priced In: Strong Growth, Low Risk, and Execution Consistency
At ~28× FY25 P/E and ~3.4× P/B, India Shelter is trading at a premium — and here's what that premium reflects:
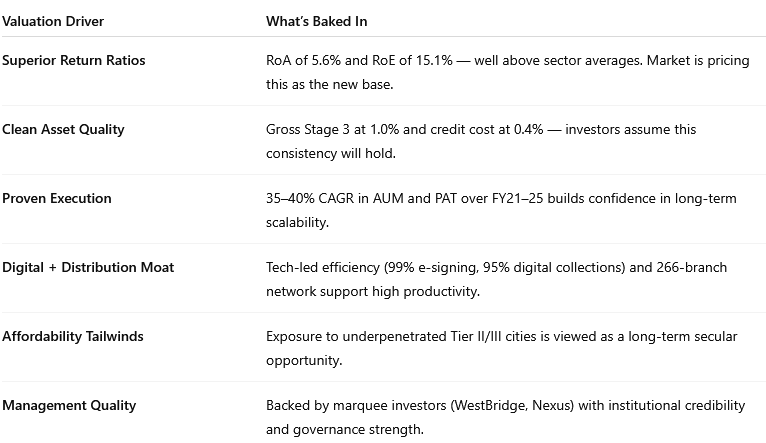
The market sees India Shelter as a structural compounder — not a cyclical lender — and is willing to pay up for predictable growth and clean risk management.
7.3 What’s Not Fully Priced In: Optional Upside & Rerating Potential
Despite rich valuations, there are several growth levers and tailwinds that are not fully priced into today’s stock:
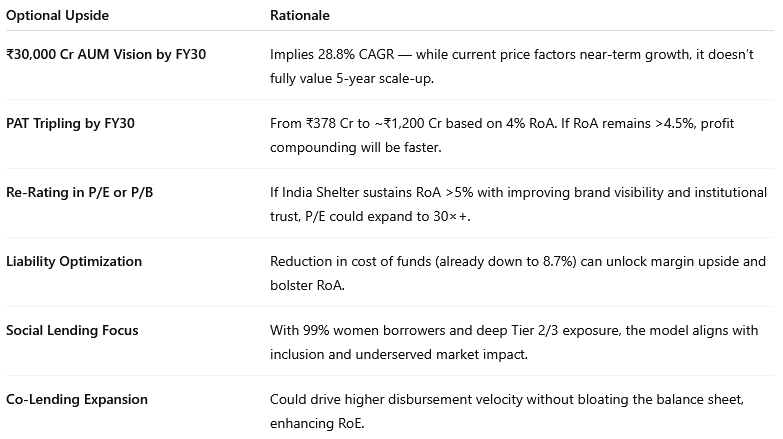
While near-term growth is priced in, the stock doesn’t yet reflect the full upside from FY30 PAT compounding, valuation re-rating, or co-lending led operating leverage.
8. Implications for Investors: What to Watch
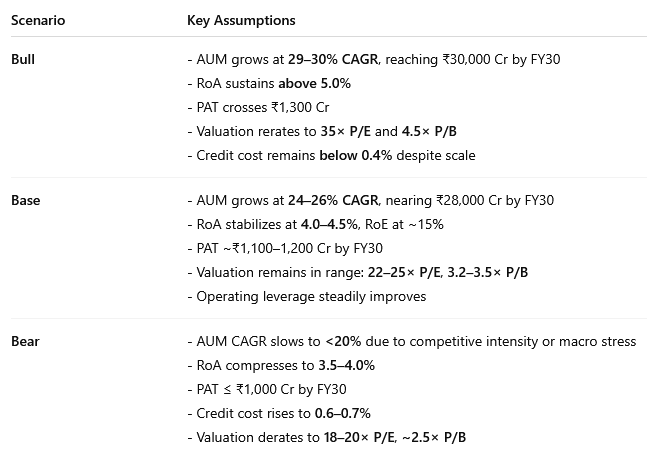
8.1 Bull, Base & Bear Case Scenarios (FY26–FY30 Outlook)
8.2 Why Investors May Want to Stay Invested or Add
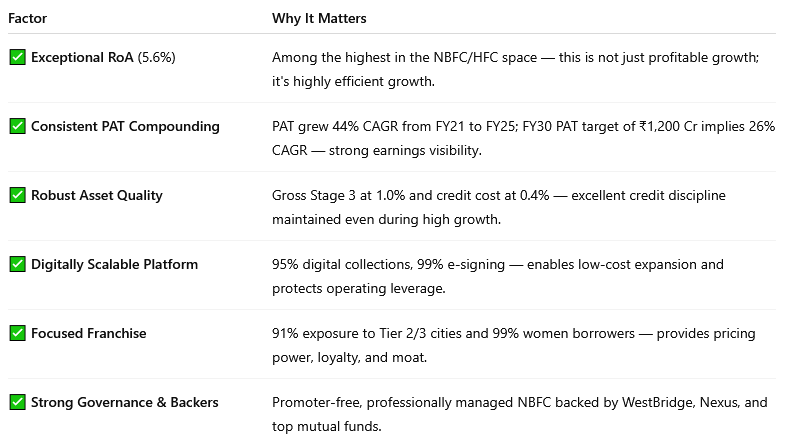
Structural Strength: RoA of 5.6%, RoE of 15.1%, credit cost at just 0.4% — signs of a clean, high-quality NBFC.
Visibility to ₹1,200 Cr PAT by FY30: Management’s AUM and RoA targets are realistic based on historic execution.
Deep Moat in Tier II/III Lending: 91% portfolio exposure in underserved markets with 99% e-signing and 95% digital collections.
Steady Operating Leverage: Cost-to-income already improved to 37.3%. Further scale should drive profitability expansion.
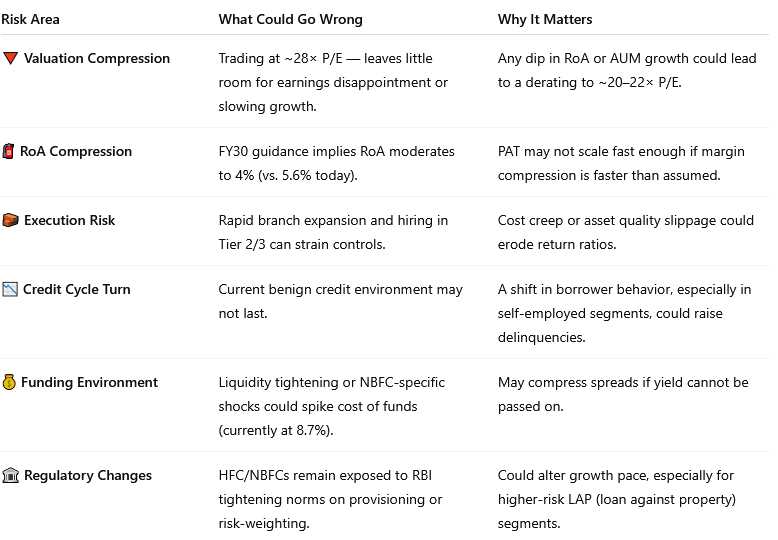
8.3 Risks to Monitor: Credit Cycle, RoA Compression, Valuation Risk
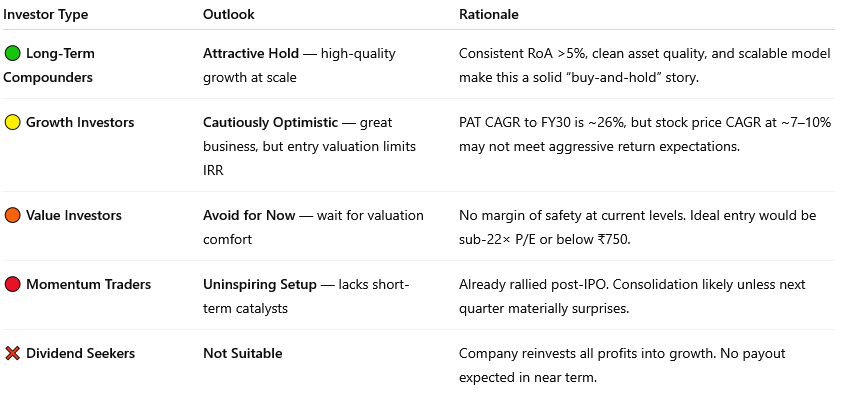
8.4 Investor Suitability: Long-Term Compounders vs Opportunistic Buyers
Previous coverage of INDIASHLTR

Got Feedback on This Analysis? Let Us Know at hi@moneymuscle.in
Read the Full Disclaimer (Important)