
India Shelter Finance: PAT up 50%, Eyes 30-35% AUM Growth in FY26
Targets ₹30,000 Cr AUM at 4.5% ROA by FY30 with 25%+ PAT CAGR. At ~8× FY30 P/E, current valuation offers strong upside if high-ROA model and scale-up play out.
1. Home Loans and Loan Against Property
indiashelter.in | NSE: INDIASHLTR

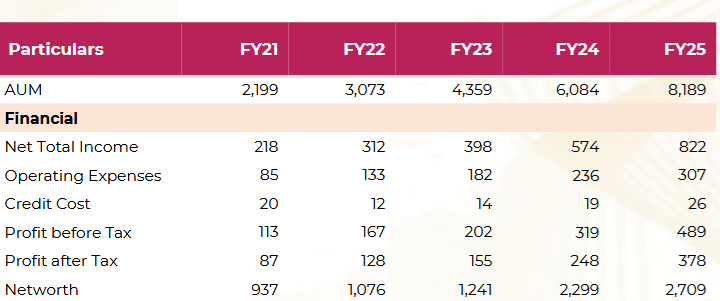
2. FY21-25: PAT CAGR of 45% & Net Total Income CAGR of 39% & AUM CAGR of 45%
2.1 What Changed Between FY21 and FY25 – India Shelter Finance
Profitability Upgraded
ROA improved driven by high-yield lending and cost efficiency.
ROE scaled despite modest leverage (2.7×), with no equity dilution.
Income Strength & Cost Discipline
Cost-to-income ratio fell from 42.7% to 37.3%.
Branch productivity improved materially.
Asset Quality Intact
GNPA held steady at 1.0%, Net Stage 3 at 0.8%, with credit cost consistently <50 bps. Low BT-Out (<6%) shows borrower stickiness and strong underwriting.
Capital Strength
CRAR stayed high at 61%, leverage remains conservative at 2.7× — offering headroom to scale ROE further as balance sheet grows.
Operating Engine Scaled
Branches more than doubled (115 → 266); active accounts tripled.
New branches now match legacy productivity in under 12 months, accelerating growth without compromising quality.
3. Q4-25: PAT up 39% & Net Total Income up 33% YoY
PAT up 12% & Net Total Income up 6% QoQ
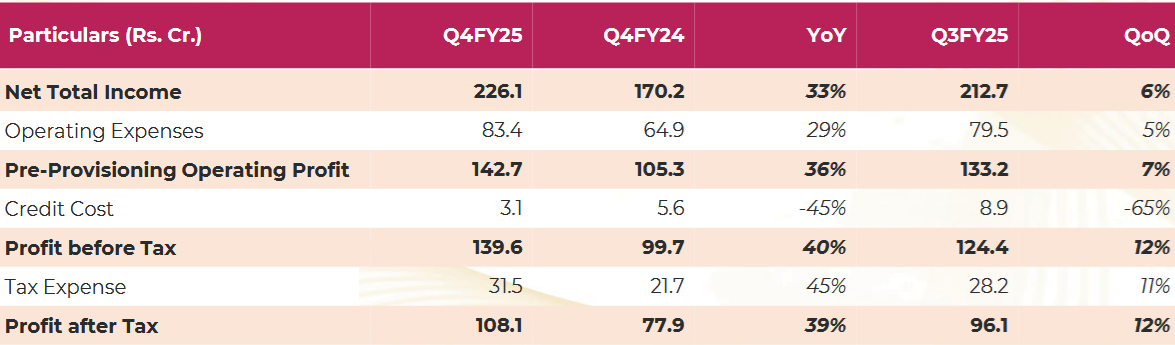
Growth moderated sequentially after a strong festive Q3, but core volumes remained healthy.
Pricing power sustained — yields stable near 14.9% with disciplined underwriting.
Cost of funds well-contained despite broader rate volatility.
Operating metrics resilient — network expansion absorbed without margin pressure.
Asset quality held firm — no deterioration in delinquency buckets.
Collection efficiency stable; digital-led recovery efforts kept credit costs low.
4. FY25: PAT up 53% & Net Total Income up 43% YoY
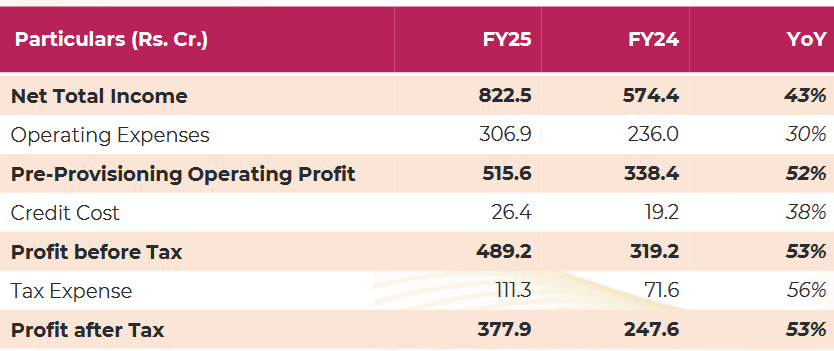
Execution aligned with strategy — deeper rural penetration, 43 new branches, 30%+ AUM growth.
Strong unit economics — improving branch productivity, rising AUM per employee.
Best-in-class asset quality — Net Stage 3 at 0.8%, credit cost at 41 bps.
Return profile scaled up — ROA at 5.6%, ROE at 15.1% despite low leverage.
Growth funded internally — no dilution, CRAR remains strong.
India Shelter exits FY25 with clear validation of its high-margin, low-risk growth engine
5. Business metrics: Return Ratios Strengthened
RoA for the quarter is 5.8% and RoA for the full year is 5.6%. RoE for the full year is 15.1%. During the quarter, we have crossed the milestone of 16% ROE for the first-time post IPO and ended the quarter with RoE of 16.3% at a leverage of 2.9x.
Our net worth now stands at Rs. 2,709 crores.

ROE remained strong post-IPO confirms that capital was deployed quickly and effectively.
India Shelter has absorbed IPO dilution well, and ROE/ROA now exceed pre-IPO levels, validating its scalable, high-margin model
Despite CRAR moderation (72% → 61%), it remains comfortably above regulatory thresholds.
GNPA fell from 1.9% to 1.0%, with consistent credit cost containment (<50 bps).
Risk management has scaled well with loan book expansion.
6. Outlook: AUM CAGR of 30-35% for FY25-30
6.1 FY25 Performance vs. Guidance

✅ FY25 – Hits (Delivered or Outperformed)
AUM Growth (34.6%): In line with guidance of 30–35%; continued high-velocity execution.
ROA (5.6%) : Best-in-class profitability in the housing finance space.
ROE (15.1%, Q4: 16.3%): Surpassed prior year and crossed 16% mark post-IPO — strong capital productivity.
Credit Cost (41 bps): At the lower end of guided range (40–50 bps); reflects tight underwriting.
Asset Quality: GNPA held steady at 1.0%, Net Stage 3 at 0.8%; no signs of stress.
Cost-to-Income (37.3%): Significant improvement vs 41.1% in FY24, despite network expansion.
Branch Expansion (+43 branches): Execution consistent with guided 40–45 additions.
Digital Penetration: 95%+ collections digital, 99% loans e-signed — strong tech enablement.
❌ FY25 – Misses (Minor or Strategic)
Leverage Ramp-up Slower Than Targeted:
Avg. leverage at 2.7× vs target of 3×+ — partially strategic to retain capital flexibility post-IPO.
CRAR Decline to 61%: Down from 71% in FY24; still well above regulatory norms but may require monitoring if leverage rises.
Operating Cost Base Still Elevated in Some New Branches: Though C/I ratio improved, some new geographies may take longer to reach branch-level profitability.
FY25 was a strong execution year — all core metrics were delivered or outperformed. Minor deviations were either strategic (leverage) or transitory (cost absorption in expansion phase).
6.2 FY26 Guidance 🎯
AUM Growth: Maintain 30–35% YoY growth
ROA: Moderate To moderate , as leverage increases and base expands
ROE: Targeting improvement (vs 15.1% in FY25), aided by higher leverage (~3.2×)
Leverage: Gradual scale-up toward 4× over 2–3 years
Credit Cost: Remain stable at 40–50 bps
Cost-to-Income: Continue improving
Branches: Add 40–45 new branches, focusing on deeper reach within existing states
Capital Needs: No immediate equity raise required;
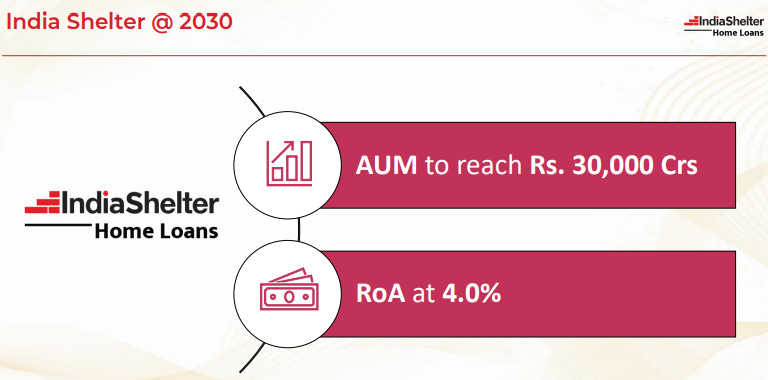
6.3 FY30 Guidance — India Shelter Finance Corporation
So our ROA is currently is about 5.6% for the year, but our leverage is close to 2.9x. So as the leverage will increase from here, our ROA will moderate from there. So we expect that down the line, 2 years from here, we will be touching close to 4x kind of leverage. At that point of time, you will see some moderation in ROA close to 4.5% that you could expect.
Additional equity raise: It would require eventually, I think, but I think it will take another 3 years to reach there. We're talking about Rs. 30,000 crores in 5 years of time.
7. Valuation Analysis
7.1 Valuation Snapshot — India Shelter Finance

Strong Growth Visibility: AUM expected to grow from ₹8,189 Cr in FY25 to ₹30,000 Cr by FY30 — a 30–35% CAGR, in line with management guidance.
Profitable and Efficient Model
ROA remains industry-leading, moderating from 5.6% to 4.5% by FY30 as scale increases — still robust.
PAT to grow 3.5×, from ₹378 Cr (FY25) to ₹1,350 Cr (FY30), despite expected dilution.
Internal Accruals Power Net Worth Growth
Net worth compounds at ~24% CAGR — from ₹2,709 Cr to ~₹8,960 Cr — driven largely by retained earnings.
One-time ₹1,000 Cr equity raise assumed in FY27 to support leverage discipline.
Valuation Compression Creates Upside
P/E compresses from 26× (FY25) → 16.8× (FY26) → 8.1× (FY30).
P/B compresses from 3.5× → 2.8× → 1.2×, indicating undervaluation on long-term metrics.
Limited Dilution Risk
Even after 15% dilution assumed in FY27, EPS and book value growth remain strong.
Return metrics (ROA, ROE) are not diluted — indicating capital efficiency is intact.
7.2 What’s in the Price?
The current valuation (~26× P/E TTM, ~17× forward P/E) reflects confidence in execution through FY26.
FY26 PAT of ₹568 Cr and AUM growth of 30–35% appear fully priced in.
The market is assigning a premium P/E of ~26× due to:
Best-in-class ROA (~5.6%)
Industry-leading cost and credit discipline
Well-telegraphed AUM scale-up plan
Implied Valuation Assumes:
Stable asset quality (GNPA <1%) with low credit cost (<50 bps)
Leverage increases to 3.2–3.3× by FY26 without weakening CRAR
Cost-to-income improves further toward 35–36%
Branch productivity and digital efficiencies hold up across new markets
Full FY26 delivery is priced in. Any slippage on growth, margins, or leverage could impact sentiment.
7.3 What’s Not in the Price?
Several medium- to long-term upsides are still underappreciated:
AUM of ₹30,000 Cr: Market may not be factoring ₹30,000 Cr+ potential by FY30, especially in low-competition Tier 2/3 markets.
Non-Housing Product Expansion: Small-ticket LAP, home improvement loans, or MSME-linked credit could lift blended ROA.
Asset-Light Distribution Models: Potential to introduce franchisees or agent-led sourcing to expand at lower cost.
ROE Expansion to 18%+: If leverage hits 4× with 4.5%+ ROA and no further dilution, FY30 ROE could scale materially.
Re-rating Potential: With sustainable PAT CAGR of 25%+, re-rating to 28–30× P/E or 3.5× P/B possible by FY27–30.
7.4 Risks and What to Monitor
While execution has been strong, valuation assumes minimal room for error. Key risks:
Execution Risks:
New branches may face longer gestation or lower AUM conversion.
Leverage ramp-up could lag, impacting ROE trajectory.
Credit/Regulatory Risks:
Local disruptions (e.g., state elections, housing subsidy policies) could impact demand or collections.
Any uptick in delinquencies may push credit cost above 50 bps.
Input/Cost Risks:
Cost-to-income improvements depend on new branch productivity — a miss could weigh on operating margins.
Rise in funding cost (rate volatility) may narrow NIMs.
Dilution Risk:
Though not immediate, equity raise by FY27 is likely to support FY30.
What to Monitor

The market is pricing in flawless FY26 execution — any deviation on AUM growth, ROA, or leverage could trigger a de-rating.
However, upside till FY30 not fully priced: new products, distribution models, and long-term scale potential offer multi-year optionality.
8. Implications for Investors
8.1 Bull, Base & Bear Scenarios — India Shelter Finance

Key Swing Factors
Execution at Scale: Timely productivity in new branches and deeper reach into Tier 2/3 markets.
Leverage Ramp-Up: Smooth expansion to 4× leverage critical to achieve ROE >17% by FY30.
Cost Efficiency: Faster decline in cost-to-income ratio could unlock margin surprise.
Funding Mix: Diversified liabilities at stable rates will be key to sustaining NIMs.
8.2 Is There Any Margin of Safety?
✅ Where There Is Margin of Safety
Business Model & Profitability
High-yield lending (14.9%+) and stable spreads support 5.6% ROA, among the best in the sector.
Proven branch-level profitability model with predictable scale-up curve across new geographies.
Cost-to-income improvement offers visible operating leverage tailwinds.
Capital Structure
Strong capital buffer with CRAR at 61% — allows AUM growth without near-term dilution.
Low average leverage of 2.7× provides scope to scale to 4×, expanding ROE structurally.
Asset Quality & Credit Discipline
Gross Stage 3 at 1.0%, Net Stage 3 at 0.8%, with consistent credit cost control (<50 bps).
BT-Out below 6% — signals borrower loyalty and underwriting quality.
Minimal risk from unsecured exposure or volatile geographies.
Valuation Compression Over Time
FY30 projections imply current CMP reflects:
~8.1× forward P/E
~1.2× forward P/B
If PAT CAGR of 25%+ sustains, valuation upside exists even without re-rating.
❌ Where There Isn’t Margin of Safety
Execution Timing
Current P/E (~26×) prices in near-perfect FY26 delivery — any miss on AUM growth, margins, or leverage could trigger de-rating.
New branches need to break even quickly to justify opex investments.
Dilution Optionality
While not imminent, ₹1,000 Cr equity raise is expected by FY27 — timing and pricing will impact per-share value.
If AUM growth lags, equity raise could arrive before operating leverage fully kicks in.
Limited Moat in Cost of Capital
As India Shelter scales, it will increasingly compete with larger, better-rated HFCs and SFBs for liabilities.
Any sustained rise in cost of funds could compress spreads.
Macro or Regulatory Overhang
Real estate-linked lending can be vulnerable to macro tightening, policy shifts, or localized stress (e.g., state caps, housing subsidy changes).
Previous Coverage of INDIASHLTR

Don’t like what you are reading? Will do better. Let us know at hi@moneymuscle.in
Don’t miss reading our Disclaimer
WHATS THEIR NIM?