
Epack Durable FY25 Results: PAT up 56%, Targeting 35%+ Growth in FY26
Growth beyond FY26 driven by new capacities and product mix; targeting 15% ROE. Exports, SDA, and components offer upside not fully priced into premium valuation.
1. 2nd Largest Room AC ODM
epackdurable.com | NSE: EPACK
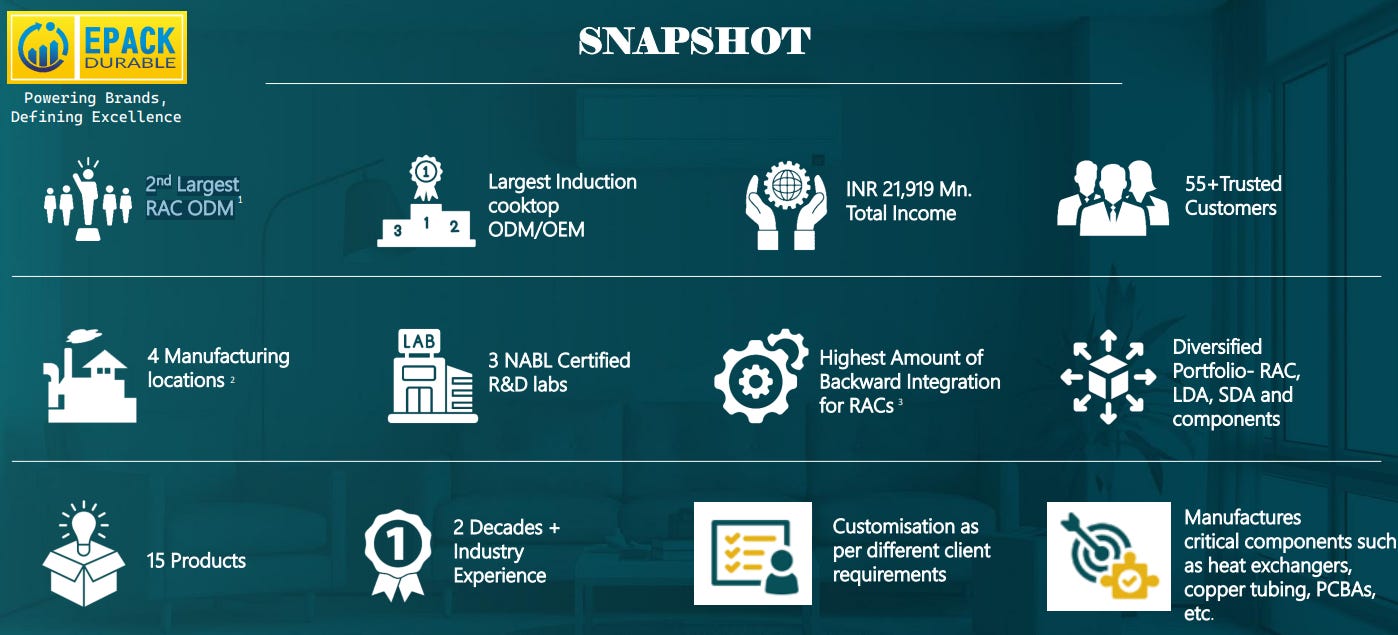
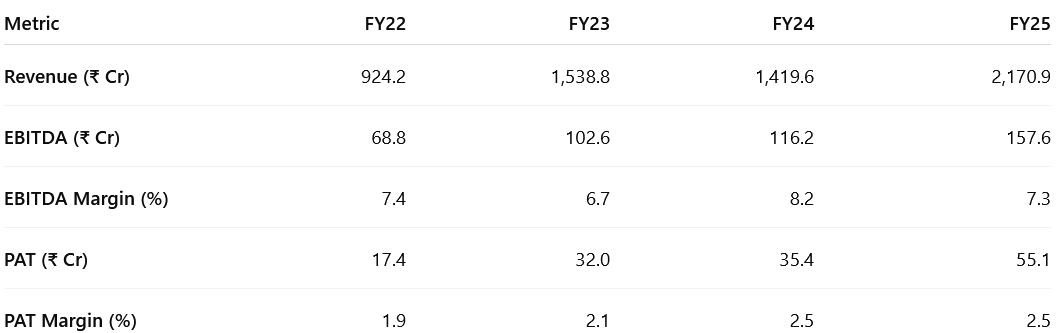
2. FY22–25: PAT CAGR 47% & Revenue CAGR 33%
2.1 FY25 vs. Prior Years – Key Shifts at EPACK Durable
From RAC-Heavy to ODM-Full Stack
FY22: RAC-dominated, limited vertical depth (RAC = Room Air Conditioners)
FY25: Broad-based ODM (Original Design Manufacturer) offering across
RAC, SDA (Small Domestic Appliances), LDA (Large Domestic Appliances), and Components
SDA and Components Emerged as Growth Engines:
SDA: Expanded with high-margin, innovation-driven products:
Air Fryers, Nutri Blenders, Coffee Makers, Induction Cooktops, etc.
Components: Scaled significantly via in-house manufacturing and JV:
PCBs (Printed Circuit Boards)
Copper Parts
Motors (including BLDC motors via JV with EPAVO)
From Contract Manufacturer to Full-Stack ODM
Earlier: Assembly-focused, consumer-durable contract manufacturing
Now: Full-stack design + manufacturing player with deeper integration and customer solutions
Marquee clients added from FY22–FY25: Hisense, Daikin, Panasonic
3. Q4-25: PAT up 36% & Revenue up 24% YoY
PAT up 1408% & Revenue up 71% QoQ
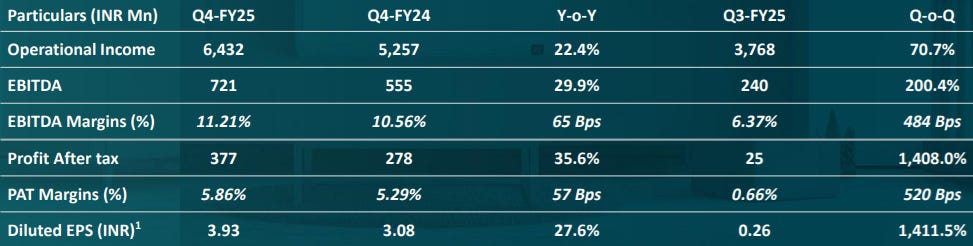
Strong QoQ Recovery: Revenue, margins, and PAT rebounded sharply.
RAC Season Held: Despite unseasonal rains in key regions, RAC volumes held strong — reflecting demand stickiness and robust OEM relationships.
Margins Expand: Better mix, cost control drove 11.2% EBITDA margin.
Non-RAC Gains: SDA + components cushioned seasonality.
Sri City Ramp Ongoing: Still suboptimal; FY26 margin lever.
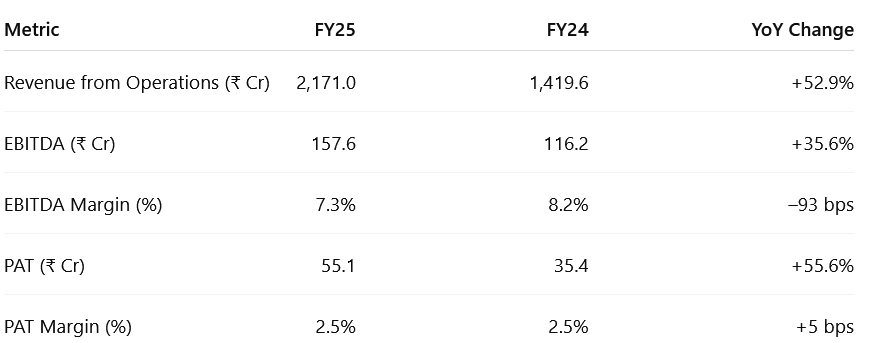
4. FY25: PAT up 56% & Revenue up 53% YoY
ODM Shift Executed: Broader mix across RAC, SDA, LDA, components.
Client Base Strengthened: Added Hisense, Panasonic; top-2 share ↓ to 48%.
Capex-Led Expansion: ₹450–500 Cr deployed to fuel multi-vertical growth.
Export Engine Ignited: RAC exports doubled; MEA push underway.
4.1 Segmental Performance – FY25
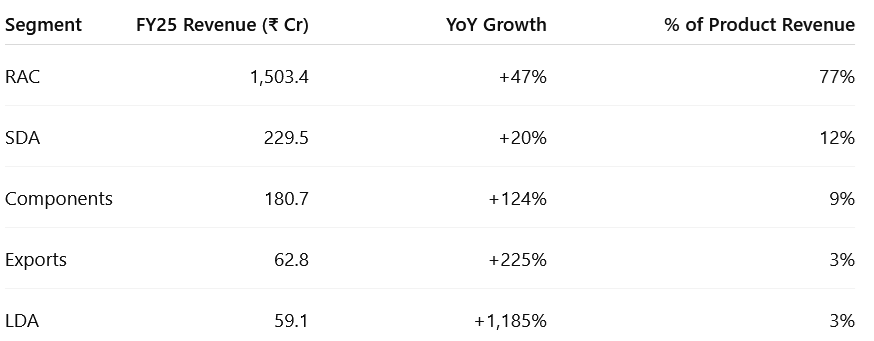
RAC: Core driver; share dipped to 77% (from 85%) as non-RAC verticals scaled.
SDA: Air fryers, cooktops, blenders; high-growth, high-margin segment.
Components: Doubled YoY; strong PCBA, copper, motor sales via EPAVO JV and PLI boost.
Exports: 2.25× jump; MEA and ODM-led growth to accelerate in FY26.
LDA: Gained traction in coolers, washing machines; new client wins fueling ramp-up.
5. Business Metrics: Return Ratios Strengthen
Mix Shift, Scale, and Efficient Capex Drive Improvement
In terms of ROE/ROCE, we are looking at anywhere around 15%-16% in next 2-3 years, so FY27-28 onwards, we definitely will be able to improve the ROE to 15% plus level.
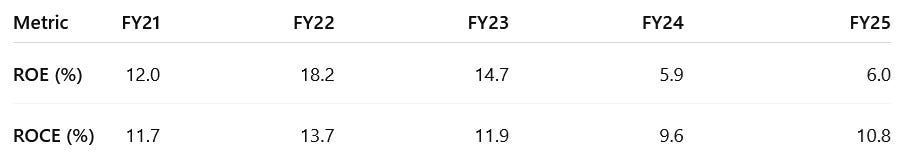
ROE/ROCE recovery in FY25 reflects early gains from scale-up in RAC, SDA, and component verticals.
ROCE improvement aided by better asset turns and improved capacity utilization.
ROE stabilized post capex-heavy FY24; PAT growth offsets equity base expansion.
Both metrics expected to rise structurally as Sri City, EPAVO, and SDA capacity scale further in FY26.
6. Outlook: Revenue growth of 35%+
6.1 FY25 Expectations vs Performance — EPACK Durable
✅ HITS (Met / Beat Guidance)
Revenue Growth on Track: Topline rose 53% YoY to ₹2,171 Cr, matching the Rs. 2,100 crores plus minus Rs. 50 odd crores of revenue guidance for FY25
Product Mix Diversification: RAC share dropped from 85% → 77%; SDA, components, and exports gained momentum.
Client Diversification: Top-2 customer share declined from 72% to 48%, improving customer concentration risk.
Capacity Commissioned: Sri City Phase-1 and Bhiwadi JV assets came online; component scale-up (PCBA, motors) began.
Export Traction Initiated: RAC exports crossed 4% of segment revenue; ODM-linked pipeline activated for FY26–27.
❌ MISSES (Below / Deferred vs Guidance)
EBITDA Delivery In-Line: 7.3% EBITDA margin delivered vs 8%+ in FY24 despite underutilized capacity at Sri City.
PAT Growth Below Operating Leverage Potential: PAT up 56%, but margin stayed flat at 2.5% despite scale.
Sri City Still Ramping: Fixed cost drag persisted as utilization remained below optimal in FY25.
ROE/ROCE Still Low: ROE at 6.0% and ROCE at 10.8% — well below 15%+ medium-term goal.
Working Capital Intensity Elevated: Net working capital days stretched to 57 (vs 45 in FY24), driven by inventory buildup.
Component/LDA Underpenetration: Despite high growth rates, absolute revenue from LDA (₹59 Cr) and exports (₹63 Cr) remained sub-scale.
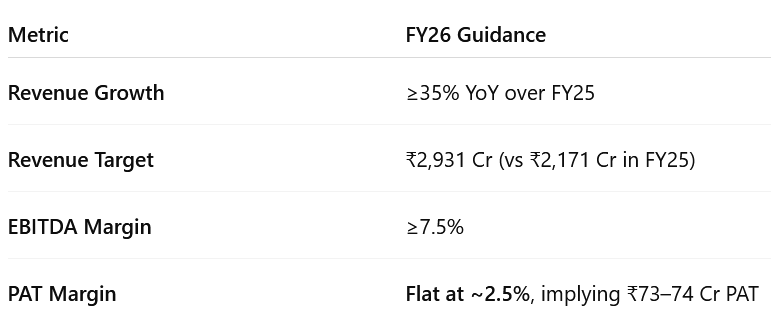
6.2 FY26 Guidance — EPACK Durable Ltd
So, in terms of top line at EPACK, we are definitely looking to grow overall by more than 35%.
We are looking at almost 35% plus kind of revenue growth for FY '26 while maintaining EBITDA at around 7.5% plus and maintaining the overall PAT levels. So, this is the guidance for FY '26.
For next 2 to 3 years, we are looking at an EBITDA margin of around 8% plus/minus. So that's a medium term kind of a guidance we have maintained since last couple of quarters.
FY26 & Beyond
Sri City plant ramp-up: Targeting >50% utilization by end of FY26.
Washing machine volumes: Commercial production to ramp up from Q2 FY26.
Cooler capacity utilization: Expected to hit 2.5 lakh units at peak in FY26.
Component JV (EPAVO – Bhiwadi): Facility fully operational by Q1 FY26; guided revenue of ₹150 Cr+ in FY26.
Export contribution: Exports at ~4% of revenue in FY25; management expects it to scale toward 10% by FY27.
ODM client ramp-up: Hisense and Panasonic ODM mandates to contribute significantly from FY26 onward.
Top-2 customer revenue share: Reduced to 48% in FY25; target to bring it closer to 40% by FY26.
7. Valuation Analysis
7.1 Valuation Snapshot — EPACK
🔍 Steep Valuation Derating Expected as Profitability Scales
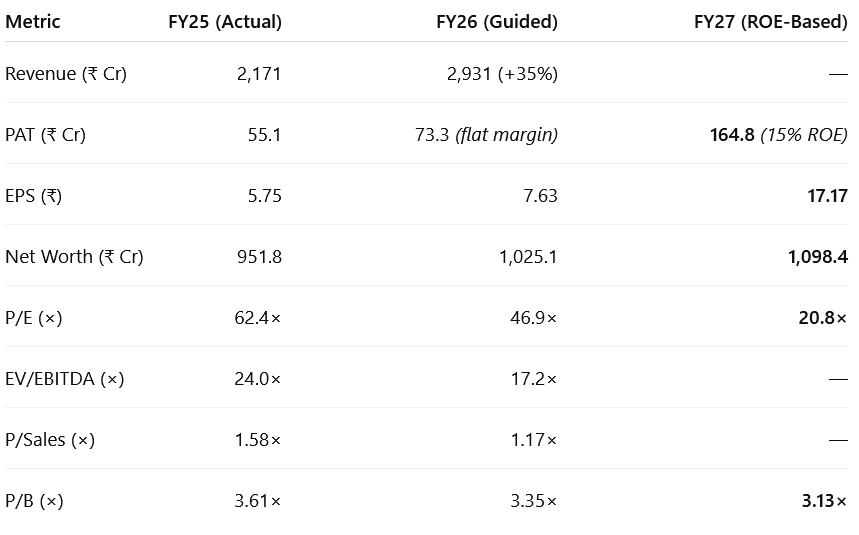
🧩 Headline Valuation
EPACK trades at 62× P/E, 24× EV/EBITDA, and 1.6× P/S on FY25 actuals — pricing in clean delivery on growth and margin roadmap.
Valuation sharply compresses by FY27 even at flat stock price, purely through earnings growth — P/E down to 21× as ROE hits 15%.
📉 Forward Convergence
FY26–27 will test EPACK’s ability to convert capacity into profits.
PAT is projected to triple over FY25–27, driven by mix improvement and scale realization.
At ₹17+ EPS and <21× P/E, EPACK may shift into a fairly priced structural compounder zone.
📊 PEG Perspective
FY25–27E EPS CAGR = ~72%
PEG falls below 0.9×, improving risk-reward
Valuation reset is more earnings-driven than sentiment-driven — re-rating optionality remains
7.2 What’s in the Price?
Valuation Reflects Confidence:
Market is baking in 35% topline growth for FY26 and >15% ROE by FY27 without execution slippage.
Growth Targets Embedded:
₹165 Cr PAT by FY27 (15% ROE) already factored in — EPS ~₹17 priced at ~21× FY27E earnings.
Capex Fully Funded:
IPO cash + internal accruals expected to fund multi-vertical ramp-up; dilution unlikely in near term.
Mix Shift Priced In:
RAC mix drop from 85% to 65%, components + SDA expansion to ~25% is already visible in margin commentary.
Client Concentration Normalized:
Drop from 72% to 48% in top-2 client share reflects successful wallet share diversification.
Capital Discipline Expected:
Asset turns expected to scale from 3.2× to 4.0× by FY27; working capital intensity seen normalizing below 60 days.
7.3 What’s Not in the Price?
Full Potential of Components Unpriced:
PCBA, motors, copper tubes scaling rapidly — FY26/27 mix impact not fully reflected in consensus.
Export Optionality:
MEA and EU markets just beginning to contribute; 4% export mix could double by FY27 on ODM scale-up.
SDA Upside Underappreciated:
New SKUs like air fryers, blenders, and coffee makers to drive margin-accretive volumes; long tail not priced.
LDA Ramp Yet to Be Discounted:
Washing machine + cooler contribution just ₹59 Cr in FY25; early stages of scale.
Margin Re-rating Optionality:
EBITDA margin expansion from 7.5% → 8% range if fixed cost leverage kicks in by FY27.
Brand-Led Transition Risk Absent:
EPACK remains a full-stack ODM; market not pricing risk buffer or premium for end-to-end design ownership.
7.4 Risks and What to Monitor — EPACK Durable
🔺 Key Risks
Execution Risk: Sri City and EPAVO ramps must deliver on time — margin recovery and PAT targets hinge on FY26 absorption.
Margin Dilution Risk: High fixed cost base may suppress PAT margins if volumes lag guidance.
Export Risk: MEA demand visibility exists, but EU scaling needs partner traction; delays may cap export mix.
Working Capital Pressure: Inventory and receivables peaked in FY25; normalization is critical to improve RoCE.
Competitive Pressure in RAC: Pricing pressure from Amber/Dixon or OEM backward integration could hurt wallet share.
Client Onboarding Risk: Design wins with Hisense and Panasonic must translate into higher offtake by FY26–27.
👀 What to Monitor
Component Scale-Up: Monitor contribution from motors, PCBAs, copper parts — high-margin growth vector.
SDA SKU Ramps: Watch Q2–Q3 traction in new SKUs (air fryers, coffee makers).
Export Mix: Any movement beyond 4% export share could materially shift FY27 valuation.
Capex Timing: Monitor deployment efficiency — any overruns or delays could drag margin realization.
RoE/ROCE Slope: Quarterly improvement trends toward FY27 targets of 15%/16% will validate current multiples.
8. Implications for Investors
8.1 Bull, Base & Bear-Case Scenarios — EPACK
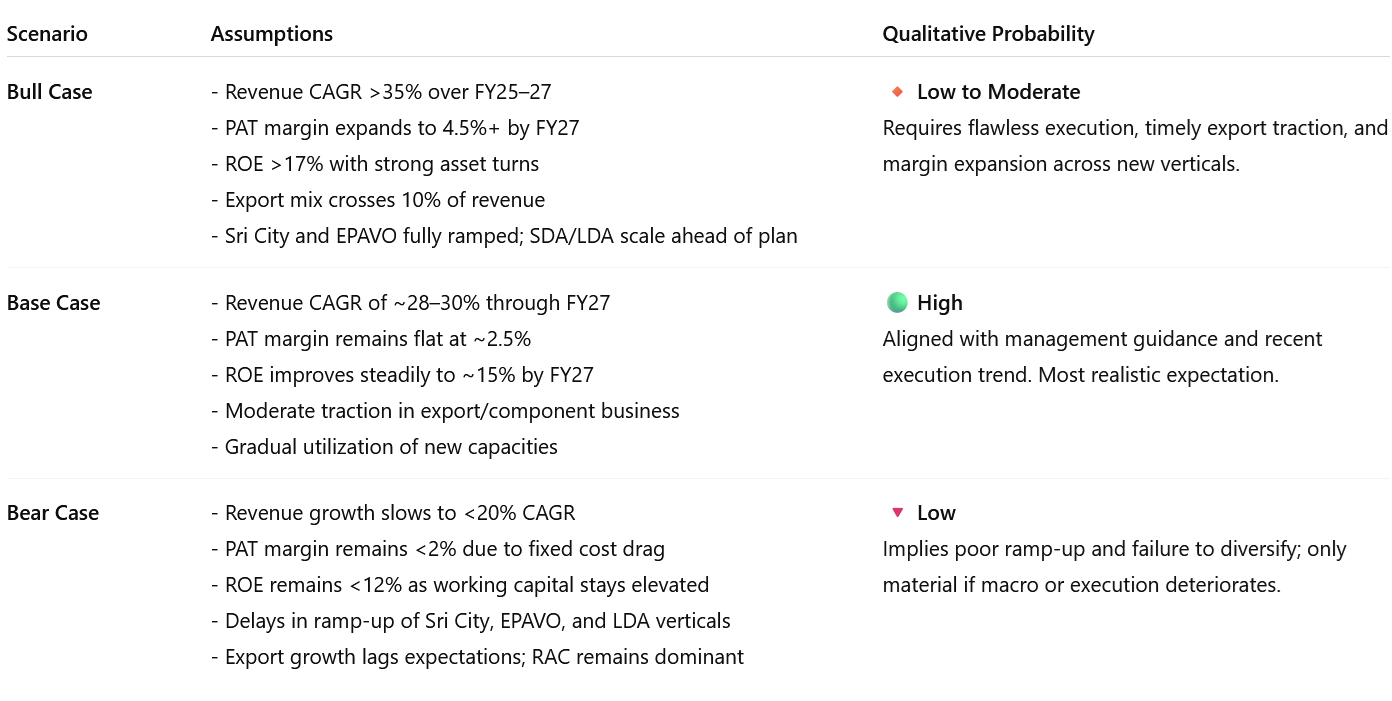
Key Swing Factors
Execution at scale: Sri City, EPAVO, and ODM wins must translate into sustained volume growth.
Mix shift margin impact: Faster transition to SDA and components can lift PAT disproportionately.
Export diversification: Doubling export contribution by FY27 could drive re-rating.
8.2 Is There Any Margin of Safety? — EPACK Durable
🧾 Revenue Growth
₹2,931 Cr in FY26E → ₹3,800+ Cr by FY27
❌ Fully priced — 35% CAGR assumption is embedded in valuation
📉 Margins
EBITDA 7.5% / PAT Margin 2.5% guided
❌ No cushion — high fixed cost base leaves no room for execution error
💰 Valuation Multiples
62× P/E, 24× EV/EBITDA (FY25)
❌ Expensive — assumes perfect ramp-up and full PAT delivery
⚠️ Execution Risk
❌ High-stakes — delays at Sri City/EPAVO, or underperformance in SDA/LDA can trigger sharp de-rating
🔄 Re-rating Potential
❌ Capped — FY27 P/E already drops to ~21× if all goes well; re-rating upside only if PAT margins scale >4%
📊 Return Ratios
❌ Low for current valuation — FY25 ROE/ROCE at 6% / 10.8%; must exceed 15–16% to justify premium multiples
💵 Balance Sheet Strength
✅ Some cushion — Low net debt & IPO cash buffers support ongoing capex and fund growth without dilution
🧮 Peer Comparison
❌ Priced at a premium — higher P/E and EV/EBITDA vs peers; no valuation headroom left
👉 Bottom Line
EPACK offers compounding — not comfort.
It is a “priced-for-perfection” story where delivery is everything.
🔎 Margin of safety = Thin.
Investors must ask: Do I believe execution will be flawless across capacity, mix, and margins through FY27?
Previous coverage of EPACK

Don’t like what you are reading? Will do better. Let us know at hi@moneymuscle.in
Don’t miss reading our Disclaimer