
Capacit’e Infraprojects FY25 Results: PAT up 70%, Vision 2028 to Drive 20%+ Growth
Capacit’e offers opportunity with 20% PAT CAGR, improving ROE, & ₹4,000 Cr revenue by FY28. Low P/E & EV/EBITDA make it a low-debt EPC play with re-rating potential
1. Construction Company
capacite.in | NSE : CAPACITE


2. FY22-25: PAT CAGR of 62% & Revenue CAGR of 21%

Revenue: Shows solid recovery and growth post-COVID disruptions.
EBITDA: Driven by shift toward high-margin EPC contracts (public sector).
2.1 What Changed Between FY21–25

Shift to High-Margin Public EPC: Benefits: price escalation, assured funding, smoother billing
Execution Focus & Cost Leverage: Fewer, larger projects from FY23.
Higher per-site revenue, flat employee cost, stable EBITDA margin
Working Capital Efficiency: NWC cycle reduced by ~37 days.
Driven by: faster billing (MHADA/CIDCO), BG-backed retention release, better private client selection.
Pure Building Focus: No roads/rail — only residential, healthcare, & commercial
Outcome: entry barriers, client stickiness (Lodha, MHADA), and higher margins vs infra peers.
3. Q4-25: PAT up 2% & Revenue up 16% YoY
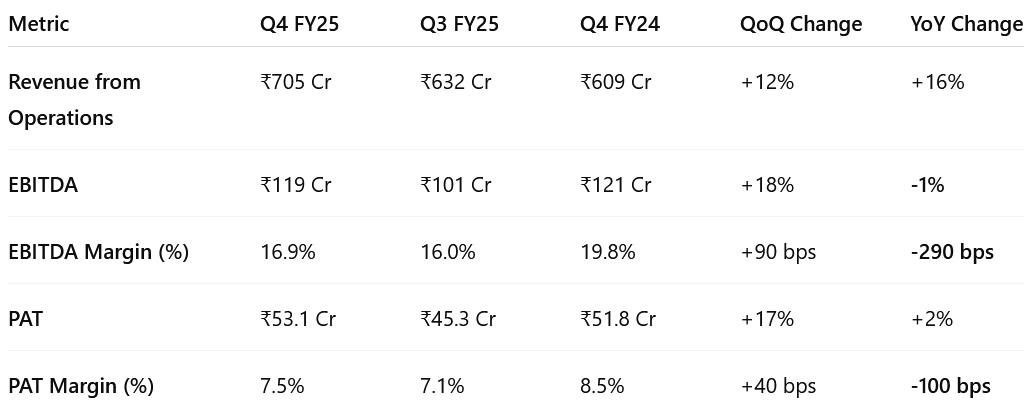
Q4 FY25 revenue was a record high for any quarter.
Margins impacted due to no profit recognition on ~₹95 Cr revenue from new EPC contracts
As per new accounting policy no profit recognition below 10% execution threshold on new EPC projects
Adjusted for this, EBITDA and PAT would have been ~₹12 Cr higher, per management commentary.
4. Strong FY25: PAT up 70% & Revenue up 22% YoY

Strong revenue growth (21.6%) driven by robust execution and new order inflows.
EBITDA margin slightly dipped due to:
Conservative accounting
Higher depreciation from capex in site establishments
5. Business metrics: Weak but improving return ratios

ROCE shows strong gains due to improved EBIT and disciplined capital deployment.
ROE for FY25 at 11.6% marks a continued uptrend from FY21 lows
6. Outlook: 25% revenue CAGR for FY24-28 with PAT growing faster
6.1 FY25 Expectations vs. Performance

HITS (Met or Exceeded Guidance)
Revenue Growth: Guided: 20–25% YoY vs Actual: ₹2,407 Cr (+23%)
Delivered, despite deferred profit recognition.
PAT Growth: Guided Strong expansion via leverage & WC vs Actual: +70%
Surpassed expectations; supported by stable interest and recovery income.
Order Inflows: Guided: ₹3,000 Cr (ex-MHADA) vs Actual: ₹2,823 Cr
Slightly below, but solid considering elections and project filtering.
Quality wins: NBCC, Signature Global.
Execution Discipline: Target: Fewer, high-billing sites vs Actual: EPC-heavy, margin-rich portfolio across key clients
Consistent project quality and execution pace.
MISSES (Below or Deferred vs Guidance)
EBITDA Margin: Guided: 17–17.5% (incl. other income) vs Actual: 18.2%
Q4 slipped to 16.9% Impacted by: deferred profit recognition policy & higher depreciation
Working Capital: Guided: 15–20 days reduction
Actual: Receivables jumped ₹548 Cr → ₹1,080 Cr
WC cycle worsened; recovery expected in FY26 H1
6.2 Guidance & Outlook for FY26 and Beyond
FY26 Guidance – Capacit’e Infraprojects
Revenue Growth: Targeting 25% YoY growth, implying revenue of ₹2,900–3,000 Cr
EBITDA Margin: Maintain in the range of 17–17.5%, including other income
PAT Growth: Strong double-digit increase expected, supported by operating leverage and flat finance costs
Order Inflow: Aiming for ₹3,500 Cr in new project wins, led by industrial, healthcare, and commercial EPC
Net Debt Reduction: Bring down net debt to ₹120–125 Cr from ₹195 Cr in FY25
Working Capital: Improve WC cycle by correcting receivables (~₹250 Cr expected reduction) and stabilizing contract assets
Capex: ₹55–60 Cr in equipment + ₹140 Cr in site establishment (to be amortized)
Vision 2028 – Capacit’e Infraprojects

Target ₹4,000+ Cr revenue by FY28 with 20%+ CAGR driven by EPC project execution.
Maintain 16.5%–17.5% EBITDA margins, including other income, through operational efficiency.
Reduce working capital intensity by accelerating collections and controlling contract assets.
Lower net and gross debt, aided by working capital release and ₹65 Cr non-core asset monetization in FY26.
7. Valuation Analysis
7.1 Valuation Snapshot – Capacit’e Infraprojects
P/E (FY25 / FY26E / FY28E): 14.3× / 11.9× / ~8.3×
P/E of 14.3× reflects early re-rating on PAT growth and capital discipline
FY26E P/E of ~11.9× looks modest given management guidance of 20% revenue & PAT growth as per Vision 2028
Long-term P/E compresses to ~8.3× by FY28, assuming PAT compounds by 20% per Vision 2028.
EV/EBITDA (FY25 / FY28E): 7.3× / ~4.3×
FY25 multiple already reasonable for a company with 18.2% EBITDA margin and strong execution.
FY28 EV/EBITDA dips to ~4.3×, assuming ₹708 Cr EBITDA on ₹4,165 Cr revenue (17% margin).
Margin strength is sustained by public EPC mix, limited capex intensity, and prudent bidding.
ROE / ROCE (FY25): 11.6% / 13.6%
ROCE expected to rise toward 16–18% by FY27–28 as scale and efficiency improve.
P/B Ratio (FY25 / FY28E): 1.65× / ~0.95×
Valuation compresses to below book by FY28, despite strong earnings and net worth growth.
Market Cap to Sales (FY25 / FY28E): 1.21× / ~0.70×
FY25: ₹2,918 Cr market cap vs ₹2,407 Cr revenue
FY28E: Multiple compresses to ~0.70× on ₹4,165 Cr revenue
Indicates under-valuation relative to expected scale-up and capital efficiency gains.
Capacit’e trades at undemanding multiples on both earnings and cash flow despite:
High revenue visibility (₹10,545 Cr order book),
Clean balance sheet (Net D/E ~0.11×),
Strong execution in high-margin government EPC projects.
With earnings normalization, working capital release, and order inflows, the stock has room for valuation rerating toward 15–18× P/E over the medium term.
7.2 What’s in the Price?
FY26 Revenue at ₹2,900–3,000 Cr:
The market appears to be pricing in ~20–25% YoY topline growth, consistent with Capacit’e’s Vision 2028 and management guidance.EBITDA Margin of 17–17.5%:
Street expectations are aligned with guided margins (including other income). Consolidated execution and public EPC mix support this range.Profit Deferral Impact Known:
Q4 FY25 margin compression due to 10% project recognition policy is largely understood by the market, muting near-term volatility.Stable Working Capital Cycle (In-Process):
Receivable spike in FY25 acknowledged, with FY26 guidance focused on ~₹250 Cr recovery and better billing cycle from public clients.High-Quality Order Book Embedded:
Current valuation factors in visibility from ₹10,500+ Cr order book, including CIDCO, MHADA, Signature Global, and NBCC.Low Net Debt / Healthy Balance Sheet:
Net D/E of 0.11× and ₹64 Cr in cash reserves are reflected in valuation confidence; downside risk from leverage appears minimal.
7.3 What’s Not in the Price? (Potential Upside Triggers)
Accelerated Profit Recognition in FY26:
Deferred profits from NBCC, Signature Global, and Maldives expected to be booked from Q2 onwards. Could surprise on margins and PAT.PAT CAGR of 20% Not Fully Valued:
Street yet to reflect PAT compounding from ₹204 Cr (FY25) to ₹350–₹400 Cr by FY28. Forward P/E compresses to single digits on FY28E EPS.ROE/ROCE Expansion:
ROE improved to 11.6% in FY25; expected to rise to 13–14% with higher profitability and asset turns. ROCE could move past 16%.Asset Monetization (₹65 Cr in FY26):
Non-core assets to be monetized, reducing net debt further and improving return ratios.P/E Re-Rating Potential:
Currently trades at ~14.3× P/E; potential to re-rate to 15–18× on sustained execution, improved WC cycle, and earnings visibility.
8. Implications for Investors: What to Watch
8.1 Bull, Base & Bear Case Scenarios – Capacit’e Infraprojects
Bull Case: All cylinders fire — strong public EPC execution, PAT compounding, working capital unlock, and re-rating
Revenue Growth:
25% CAGR through FY28 driven by full-scale execution across MHADA, CIDCO, Signature Global, NBCC, and new industrial orders.EBITDA Margin:
Expands to 18–19% as fixed costs stabilize, scale improves, and deferred profit recognition flows in from large EPC jobs.PAT Growth:
25%+ CAGR leads to PAT of ₹400 Cr+ by FY28; ROE rises to 14–15%, supporting a P/E re-rating toward 16–18×.Working Capital Efficiency:
Receivables decline by ₹250+ Cr over FY26, reducing NWC intensity. Net debt falls below ₹100 Cr.Capital Allocation:
₹65 Cr asset monetization supports deleveraging; strong internal accruals enhance optionality for dividends or strategic investment.Valuation Upside:
Stock re-rates to 15–18× P/E
Base Case: Execution meets expectations; earnings compound steadily with stable margin and working capital profile
Revenue Growth:
20% CAGR in line with Vision 2028; order book sustains at ₹10,000–12,000 Cr with public-private mix.EBITDA Margin:
Stable at 17–17.5% including other income; no major cost surprises or pricing pressure.PAT Growth:
20% CAGR takes PAT to ₹353 Cr by FY28; ROE sustains at 12–13% with steady return metrics.Working Capital:
Gradual improvement; net debt reduces to ₹120 Cr by FY26 and remains range-bound.Valuation Stabilizes:
P/E remains in the 12–14× range.
Bear Case: Profit recognition delays extend, working capital remains elevated, or margin slippage from cost spikes
Revenue Growth:
<15% CAGR; order execution lags due to site bottlenecks, labor shortages, or political delays.EBITDA Margin:
Slips to 15–16% due to continued deferral of high-margin projects and cost overruns on lump-sum contracts.PAT Growth:
PAT CAGR falls to 10–12%; ROE stagnates below 11%.Working Capital Strain:
Receivables remain above ₹1,000 Cr; contract assets don’t reduce materially; net debt stays elevated.Valuation Risk:
P/E compresses to 9–10×.
8.2 Key Risks & What to Monitor – Capacit’e Infraprojects
A. Execution Risk – Public EPC Ramp-Up
FY26 will see ramp-up of large public sector EPC projects (NBCC, MHADA, CIDCO). Delays in site clearances, design approvals, or billing certifications can impact revenue recognition and margin realization.
Monitor: Project-wise execution status, billing progress vs BOQ, design freeze timelines, site readiness (MHADA rehab/sale towers, CIDCO sectors), and quarterly execution run-rates.
B. Margin Risk from Deferred Recognition
The 10% project completion threshold for profit recognition defers revenue and margin visibility. If project timelines slip, near-term EBITDA may appear suppressed despite actual execution.
Monitor: Quarterly disclosures of % project completion, billing-to-cost ratios, transition to profit recognition phase for NBCC, Signature Global, and Maldives contracts.
C. Order Book Conversion & Tendering Pipeline
Order book is healthy, but conversion to revenue depends on timely mobilization and client-side approvals. Slower-than-expected bid conversion or deferral of ₹3,500 Cr FY26 inflow guidance could impact FY27 visibility.
Monitor: Tender win rates, order inflow disclosures, bid pipeline mix (industrial, healthcare, institutional), and FY26 order conversion progress.
D. Working Capital & Cash Flow Risk
Receivables surged in FY25 (~₹1,080 Cr) due to transition from WIP to certified billing. If collections from public clients lag or retention release slows, WC intensity could stay high.
Monitor: Quarterly receivables and contract asset trends, collection momentum (especially Q1–Q2 FY26), and asset monetization (₹65 Cr FY26 target).
E. Valuation Sensitivity
Capacit’e trades at ~14.3× FY25 P/E. Any delay in WC normalization, margin realization, or order wins could compress valuation multiples.
Monitor: Quarterly margin updates, PAT trajectory, revisions to growth guidance, and deviations from 25% revenue CAGR roadmap.
F. Policy & Sector Exposure
Changes in government policies (housing schemes, infra tendering rules, or labor availability norms) could impact project approvals or input cost inflation.
Monitor: State/National EPC policy updates, labor law implementation timelines, steel/cement input cost trends, and pre-election award cycles.
9. Margin of Safety for a Capacit’e Investor
A. Valuation Reflects Execution Stability, Leaving Room for Upside
At ~14.3× FY25 P/E and ~7.3× EV/EBITDA, Capacit’e trades at valuation levels that embed solid execution and cash generation, but not full PAT compounding potential.
Current valuation assumes:
Revenue grows 20–25% CAGR to ₹4,000+ Cr by FY28, per Vision 2028
EBITDA margins stabilize at 17–17.5%, aligned with historical guidance
Deferred profit from large EPC orders (NBCC, MHADA, Signature Global) starts reflecting from Q2 FY26
Net debt stays controlled, with ₹65 Cr asset monetization aiding capital structure
Valuation leaves scope for re-rating if Capacit’e sustains growth and working capital improvement. EPS scaling from ₹24 (FY25) to ₹41+ by FY28 is not yet fully priced in.
B. Execution Ramp-Up Is the Core Growth Lever
The ₹10,545 Cr order book is deeply execution-led and focused on public sector visibility and billing stability through FY26–28.
NBCC, MHADA, CIDCO projects are expected to drive ₹2,000+ Cr billing annually from FY26
New industrial & healthcare EPC orders expected in FY26 inflows
Order inflow guidance of ₹3,500 Cr in FY26 not yet factored into valuation
Deferred revenue (~₹95 Cr in Q4 FY25) creates a base for sharp PAT scaling in FY26 without requiring new wins
These are certified, execution-backed projects. Realization and cost control are the key drivers of compounding, not aggressive order chasing.
C. Downside Protection Is Strong Despite Execution Risks
Even if execution or collections are slower than projected, Capacit’e offers structural downside buffers:
Low valuation multiples: P/E <15× and EV/EBITDA <7.5× on FY25
Minimal equity dilution risk: No further capital raise required; self-funded capex and asset monetization in place
Net D/E of just 0.11× with strong banking limits and ₹64 Cr cash cushion
Deferred profitability optionality: Already-executed projects will start recognizing profits automatically by FY26
No exposure to cyclical infra segments (roads, rail, irrigation) — only high-margin urban buildings
These factors don’t eliminate volatility, but offer strong downside protection in a weak macro or delayed execution scenario.
9.1 Overall Margin of Safety: Moderate to High
Capacit’e offers a moderate-to-high margin of safety for long-term investors, underpinned by strong earnings visibility, robust order book, and undemanding valuations.
Current valuation reflects only:
FY26 execution outlook with deferred PAT from NBCC, Signature Global, and MHADA not yet fully realized
Base-case assumptions for EBITDA margin (~17%) and PAT CAGR (~20%)
Upside optionality from:
Working capital release and asset monetization (₹65 Cr planned in FY26)
PAT compounding to ₹350–400 Cr by FY28
Order inflows of ₹3,500 Cr in FY26 not yet fully priced in
Potential P/E re-rating from current 14.3× to 15–18× with consistent execution
This makes Capacit’e a compelling compounder over a 2–3 year horizon. Execution discipline, margin preservation, and capital-light scaling provide a favorable risk-reward framework for long-term value creation.
Previous Coverage of CAPACITE

Don’t like what you are reading? Will do better.` Let us know at hi@moneymuscle.in
Don’t miss reading our Disclaimer