

TL;DR
Overall Ranking: Mahabank #1, Indian Bank #2, IOB #3, Canara #4, SBI #5
Growth: Mahabank remains strongest; Indian Bank is the most balanced. Central Bank is the fastest lender. Union Bank still has a deposit-growth problem
Profitability: Mahabank leads. IOB and Indian Bank remain strong. Bank of India and Union Bank improved the most
Asset Quality: IOB remains best. Mahabank and Indian Bank have the cleanest net books. Bank of Baroda weakened
Capital: Sector-wide capital is comfortable. IOB and Mahabank combine strong capital with strong returns
Valuation: Mahabank still offers the best premium-quality value. Bank of India and Canara look most attractive on re-rating/value.
Before buying: Check ROA, deposit vs loan growth, and valuation vs fundamentals.
1. Business Growth
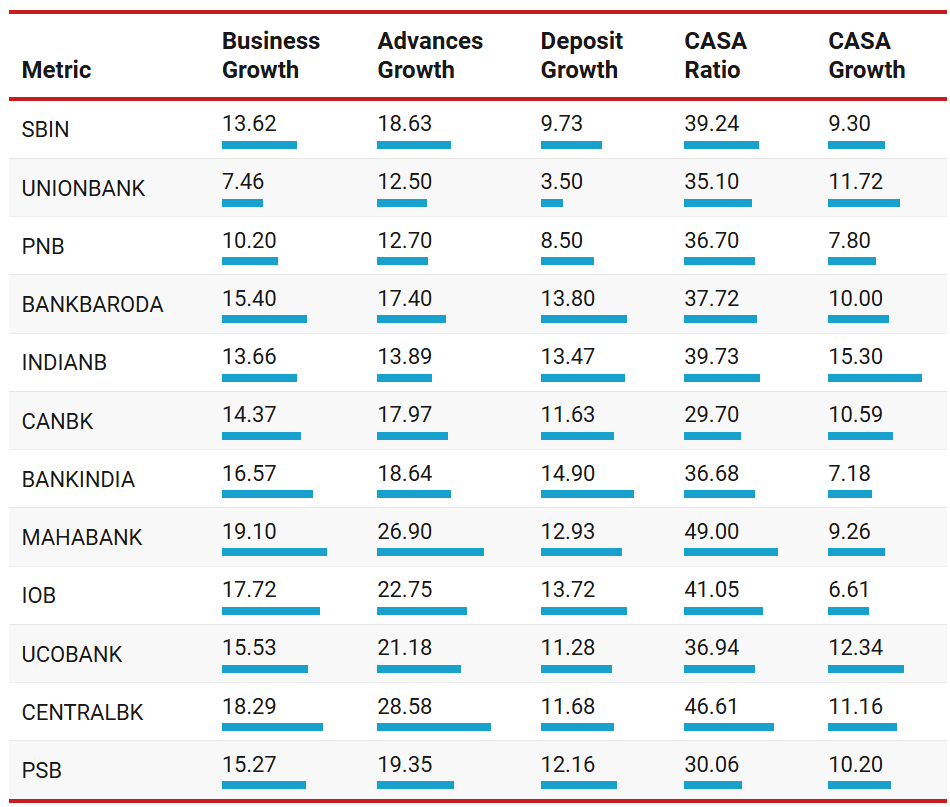
The Q1 FY27 data shows four clear patterns:
Mahabank remains the strongest growth franchise,
Indian Bank has the most balanced growth
Union Bank still has a funding problem.
IOB continues to grow strongly, while Central Bank has emerged as the fastest lender.
1.1 Mahabank remains the strongest growth franchise
Advances accelerated from 21.7% in FY26 to 26.9% in Q1 FY27
CASA remains the highest in the group at 49%
The change to watch is funding
Deposit growth slowed from 14.1% to 12.9%
Loans are now growing more than twice as fast as deposits
Mahabank still has a major funding advantage because of its high CASA base. But the widening loan-deposit growth gap needs monitoring.
1.2 Indian Bank has the most balanced growth profile
Indian Bank’s growth is slower than Mahabank or IOB, but the balance is better:
Advances, Deposits, CASA — All three are growing together
CASA growth has accelerated from 10.9% in FY26 to 15.3%, strengthening the funding mix
Indian Bank is growing without creating a visible funding mismatch.
1.3 IOB remains a high-growth bank, but growth has moderated
IOB was the fastest-growing bank at FY26. Though FY26 growth has slowed, Q1 remains strong:
IOB’s growth remains strong. The pace of improvement in its funding base has slowed.
1.4 Central Bank has become the fastest lender in the group
Advances growth accelerated from 18.8% in FY26 to 28.6% in Q1 FY27
The bank also retains a strong 46.6% CASA ratio, second only to Mahabank
Deposit growth, however, is much lower at 11.7%
It has one of the widest gaps between loan and deposit growth
The balance sheet is growing rapidly. The next question is whether that growth is producing adequate profitability.
1.5 Union Bank’s deposit problem remains unresolved
At FY26, Union Bank was already the main concern in this section: deposits grew only 2.7% against 9.7% advances growth. In Q1 FY27 the mismatch has widened as Advances grew 12.5% while Deposits lagged at 3.5%
CASA growth is the positive: it improved sharply from 1.7% to 11.7%.
So the composition of deposits is improving, but the overall deposit base is still not growing fast enough.
Union Bank remains the weakest funding story in the group.
1.6 Bank of Baroda is less conservative than at FY26
At FY26, Bank of Baroda grew deposits 16.2% against only 12% advances growth — a deliberately conservative funding position. Q1 reverses that:
Advances: 17.4%
Deposits: 13.8%
CASA ratio: 37.7%
The balance sheet remains reasonably balanced, but the funding cushion has narrowed.
Bank of Baroda remains balanced but is no longer deposit-led. Canara’s growth is good, but its funding mix is weaker than peers.
1.7 Canara stands out with a weak CASA base
Its weakness is CASA: 29.7%, the lowest in the group.
Mahabank remains the strongest growth franchise, although its loan-deposit growth gap has widened. Indian Bank has the most balanced growth profile. IOB continues to grow strongly but has slowed from FY26. Central Bank has become the fastest lender, backed by a strong CASA franchise but much slower deposit growth. Union Bank remains the main funding concern.
2. Profitability — Who Is Actually Earning From Their Growth?
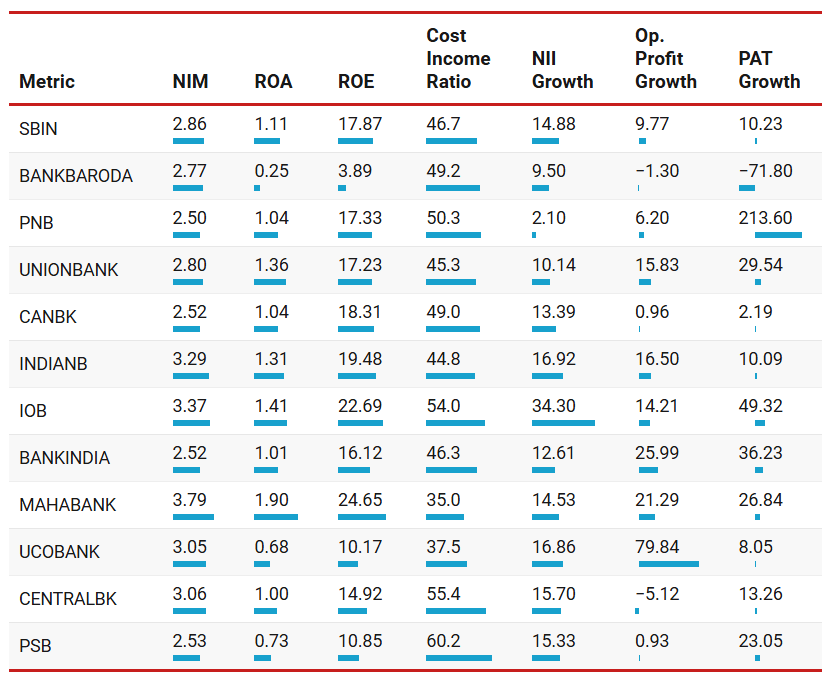
Q1 FY27 shows a wider profitability gap than FY26.
Mahabank remains clearly ahead.
IOB and Indian Bank remain strong.
Union Bank and Bank of India have improved materially.
PNB has recovered, but core income growth is still weak.
2.1 Mahabank remains the profitability benchmark
At FY26, Mahabank already led the sector on ROA, ROE and efficiency.
Q1 strengthened that position:
NIM eased from 3.90% to 3.79%, but better efficiency more than offset the pressure.
Mahabank is still the most profitable PSB by a wide margin.
2.2 IOB’s earnings engine has strengthened, but costs are holding it back
IOB improved across the core return metrics of NII growth, ROA, ROE, NIM
The weak point is cost-to-income, which rose from 44.9% to 54.0%
That explains why operating profit grew only 14.2% despite 34% NII growth
The lending business is getting stronger. Operating efficiency now needs to catch up.
2.3 Indian Bank remains the most consistent performer
Indian Bank’s return ratios i.e. ROEA & ROE barely changed:
But earnings momentum improved sharply:
NII growth: 6.9% → 16.9%
Operating profit growth: 4.8% → 16.5%
Cost-to-income improved to 44.8%
Indian Bank was already profitable. Q1 shows the underlying earnings engine accelerating.
2.4 Union Bank and Bank of India are the biggest improvements from FY26
Union Bank had shown de-growth of core income at FY26
NII: -1.5% → +10.1%
Operating profit: -7.9% → +15.8%
ROA: 1.25% → 1.36%
The profitability problem has clearly improved.
Bank of India has also crossed an important threshold:
ROA: 0.93% → 1.01%
NII growth: 3.2% → 12.6%
Operating profit growth: 3.9% → 26.0%
Cost-to-income: 51.4% → 46.3%
Union Bank has restored earnings momentum. Bank of India has finally crossed 1% ROA.
2.5 PNB recovered — 214% PAT growth overstates improvement
The important change is not the PAT number
It is that NII has turned positive and ROA has crossed 1%
But 2.1% NII growth is still weak
PNB has moved from deterioration to recovery. It has not yet become a strong earnings story.
2.6 UCO Bank, Central Bank and PSB still need better profit conversion.
UCO Bank’s cost-to-income improved sharply to 37.5%, and operating profit grew 79.8% — yet ROA is only 0.68%.
Central Bank grew NII 15.7%, but operating profit fell 5.1%. Cost-to-income remains high at 55.4%.
PSB grew NII 15.3%, but operating profit increased just 0.9%. Cost-to-income is still 60.2%, the worst in the group.
All three are generating more income. They are not yet converting enough of it into acceptable returns.
2.7. Bank of Baroda still lacks a clear operating recovery
Its reported ROA, ROE and PAT are distorted by an exceptional item, so those headline numbers are not useful for peer comparison.
The cleaner operating numbers are:
NII growth: 9.5%
Operating profit growth: -1.3%
Fee income growth: -20.4%
That is not yet an earnings recovery.
Bank of Baroda remains profitable at the franchise level, but Q1 operating momentum is weak.
Mahabank remains the clear profitability leader. IOB and Indian Bank continue to produce strong returns, although IOB’s higher costs need attention. Union Bank and Bank of India show the biggest improvement from FY26. PNB has crossed 1% ROA, but core-income growth remains weak. Canara enters with good return ratios but little profit acceleration. UCO Bank, Central Bank and PSB still need to convert income growth into stronger ROA.
3. Asset Quality — Whose Clean Books Are Real?
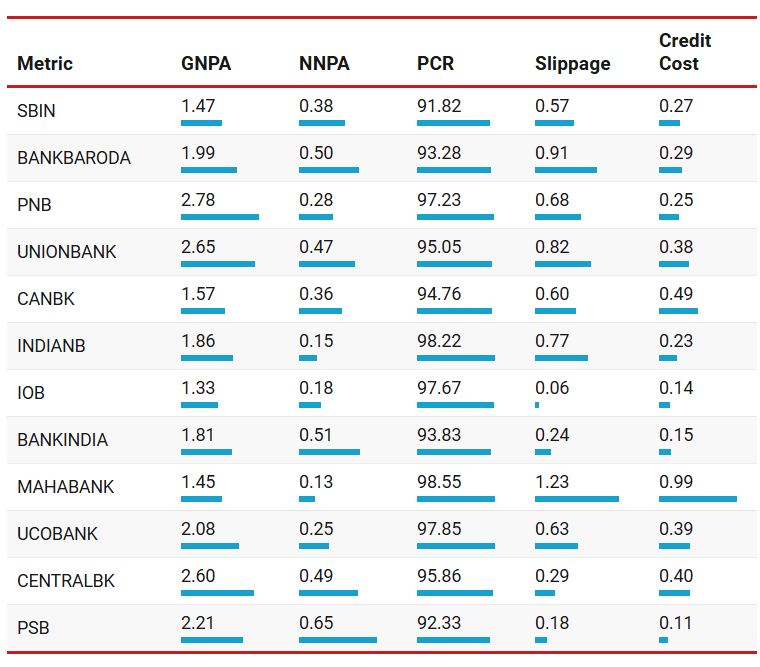
Q1 FY27 broadly strengthens the sector’s asset-quality picture.
IOB remains the standout. Mahabank and Indian Bank still have the cleanest net books
Central Bank and Bank of India improved sharply. PSB remains the weakest residual book, while Bank of Baroda moved in the wrong direction.
3.1 IOB remains the asset-quality leader
At FY26, IOB already had the lowest GNPA and near-zero slippage.
Q1 improved further — This is important because advances are still growing 22.75%.
IOB is sustaining high loan growth without creating fresh stress.
3.2 Mahabank and Indian Bank still have the cleanest net books
Their NNPA ratios are almost unchanged
Both also maintain PCR above 98%
The legacy bad-loan risk is therefore almost fully provided for.
On residual credit risk, these remain the two cleanest books in the sector.
3.3 Mahabank’s slippage remains its one asset-quality weakness.
In FY26, Mahabank’s 1.25% slippage was the highest in the group
Q1: 1.23% — Almost no change
Credit cost is also high at 0.99%.
That is not a balance-sheet problem today — NNPA is only 0.13% because the bank is provisioning aggressively.
But with advances growing 26.9%, fresh stress needs to come down.
The book is clean. The flow of new stress is still too high.
3.4 Central Bank and Bank of India show the biggest improvement
Central Bank’s slippage fell from 1.16% to 0.29%.
That is particularly important because advances are now growing 28.6%, the fastest in the group.
Bank of India also improved sharply:
GNPA: 1.98% → 1.81%
NNPA: 0.56% → 0.51%
Slippage: 0.83% → 0.24%
Credit cost: 0.48% → 0.15%
Both banks are growing faster without a corresponding rise in fresh stress.
2.5 PSB is improving, but still has the weakest residual book.
In FY26, PSB had the highest NNPA and lowest PCR in the group.
Q1 is better:
But NNPA is still the highest in the group.
The direction has improved. The cleanup is not complete.
6. Bank of Baroda is the main negative change
GNPA, NNPA, Slippage numbers in Q1 FY27 have shown clear signs of weakening all the the three metrics
PCR also slipped slightly to 93.28%
One quarter is not enough to establish a trend, but the direction is weaker than most peers.
Bank of Baroda is the asset-quality name that needs closer monitoring after Q1.
2.7 PNB and UCO Bank continue to clean up legacy stress
PNB still has the highest GNPA at 2.78%, but NNPA is only 0.28% and PCR is 97.23%.
UCO Bank shows a similar pattern with GNPA at 2.08% but NNPA is only 0.25% with PCR: at 97.85%
Both still carry large gross NPA books, but most of the shareholder risk has already been provisioned.
The headline GNPA looks worse than the residual exposure.
Asset Quality Matrix
Best overall: IOB
Cleanest net books: Mahabank, Indian Bank
Biggest improvement: Central Bank, Bank of India
Legacy stress largely covered: PNB, UCO Bank, Union Bank
Needs monitoring: Bank of Baroda
Weakest residual book: PSB
IOB remains the asset-quality standout: 22.75% loan growth with just 0.06% slippage. Mahabank and Indian Bank still have the cleanest net books, although Mahabank’s 1.23% slippage remains its main weakness. Central Bank and Bank of India show the strongest improvement from FY26. PSB is improving but still carries the highest residual NPA risk. Bank of Baroda is the one bank where Q1 asset-quality trends weakened.
4. Capital Adequacy — Who Has the Firepower to Keep Growing?
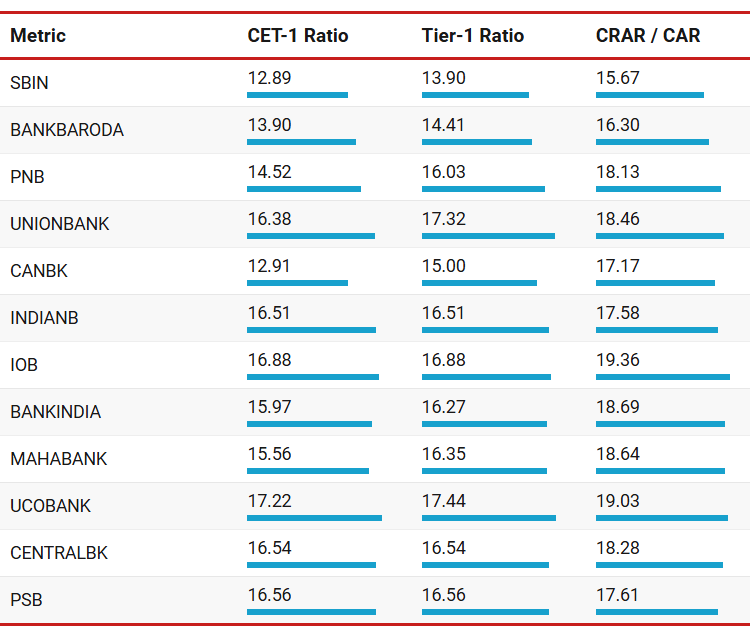
Capital remains a strength across the sector.
Every bank has a CRAR above 15%
Most of the faster-growing banks still have substantial buffers.
The question is whether that capital is being deployed at attractive returns.
4.1 IOB still has the strongest capital-growth combination.
At FY26, IOB led the group with 19.78% CRAR while growing advances above 24%.
Capital has moderated slightly as the bank grows, but remains the highest in the group.
IOB has both the capital to grow and the returns to justify deploying it.
4.2 Mahabank funding rapid growth through strong internal earnings
Its capital ratios are not the highest, but its profitability is.
That matters because high ROA and ROE continuously replenish capital even as the loan book expands.
Mahabank’s 27% credit growth is not creating a visible capital constraint.
4.3 BOI and Central Bank have enough capital for their faster growth
Bank of India now has 18.69% CRAR and 15.97% CET-1, alongside 18.6% advances growth.
Combined with the improvement to 1.01% ROA, its capital position strengthens the broader recovery case.
Central Bank is even more aggressive:
Advances growth: 28.6%
CET-1: 16.54%
CRAR: 18.28%
Capital is clearly not limiting Central Bank’s growth.
Its constraint remains profitability: ROA is only 1.00% and operating profit declined in Q1.
Both banks have growth headroom. Bank of India is currently converting it into earnings more effectively.
44. SBI remains at the lower end of the capital table, without showing signs of stress
In FY26, SBI had the lowest CRAR at 15.40%, but its large profit engine made the lower buffer manageable.
Q1:
CET-1: 12.89%
Tier-1: 13.90%
CRAR: 15.67%
All three ratios improved while advances grew 18.63%.
SBI still has the least capital headroom in the group, but Q1 gives no indication that capital is restricting growth.
4.5 Bank of Baroda and Canara have less headroom than most peers.
Bank of Baroda’s CRAR improved from 15.82% in FY26 to 16.30% in Q1. At FY26, its relatively low capital buffer was already one of the constraints we highlighted.
Canara enters with:
CET-1: 12.91%
Tier-1: 15.00%
CRAR: 17.17%
Both are adequately capitalised.
But relative to IOB, Mahabank, Bank of India or Union Bank, they have less room to absorb very rapid balance-sheet expansion without stronger internal capital generation.
4.6 UCO Bank still has more capital than it is earning from.
UCO Bank has one of the strongest capital positions:
CET-1: 17.22%
CRAR: 19.03%
But:
ROA: 0.68%
ROE: 10.17%
This was already the issue at FY26, when high capital ratios sat alongside weak profitability.
The capital is available.
The problem is the return being earned on it.
Capital Strength vs. Capital Efficiency
Strong capital + strong returns: IOB, Mahabank, Indian Bank, Bank of India
Strong capital + weaker returns: UCO Bank, PSB, Central Bank
Lower headroom but adequate: SBI, Bank of Baroda, Canara Bank
Capital is not a constraint for the PSB sector in Q1 FY27. IOB has the strongest combination of capital, growth and returns, while Mahabank’s high profitability allows it to self-fund rapid credit growth. Bank of India has strengthened both capital and profitability. Central Bank has ample capital for its 28.6% loan growth, but still needs better earnings conversion. SBI remains at the lower end of the capital table without showing signs of stress. UCO Bank continues to have the opposite problem: plenty of capital, but insufficient returns on it.
5. Valuation — Where Is the Market Getting It Wrong?
Q1 FY27 creates a clearer split between quality already priced in and improving banks that still trade cheaply.
5.1. Mahabank remains the best premium-quality valuation
The multiple fell while profitability improved
IOB trades slightly higher at 2.12x book, despite lower ROA and ROE
Mahabank still offers the better price-to-quality combination. At FY26 too, this gap versus IOB was one of the main valuation opportunities
5.2 IOB’s premium is more justified than it was at FY26
IOB’s P/B has fallen from 2.39x to 2.12x.
At the same time:
ROA improved to 1.41%
ROE improved to 22.69%
NII growth reached 34.3%
Slippage fell to 0.06%
So the business improved while the valuation became cheaper.
IOB is still expensive relative to peers, but the premium now has stronger fundamental support.
5.3 Bank of India has become the clearest re-rating candidate
At FY26, Bank of India traded at 0.85x book with 0.93% ROA. We said the key trigger was ROA crossing 1%
Q1:
P/B: 0.85x
ROA: 1.01%
Operating profit growth: 26.0%
PAT growth: 36.2%
The valuation has not changed.
The fundamentals have.
If ROA stays above 1%, the discount to book becomes increasingly difficult to justify.
5.4 Canara enters as one of the best value-quality combinations
Canara trades at 1.05x book with:
ROA: 1.04%
ROE: 18.31%
Advances growth: 18.0%
GNPA: 1.57%
The weakness is its low 29.7% CASA ratio and limited operating-profit growth.
But those weaknesses are already reflected in the valuation.
An 18% ROE bank at roughly book value deserves attention.
5.5 Indian Bank remains reasonably priced for its consistency
Indian Bank trades at 1.73x book, slightly below 1.77x at FY26
Meanwhile:
ROA remains 1.31%
ROE remains around 19.5%
NII growth accelerated to 16.9%
NNPA remains 0.15%
There is no turnaround premium here and no major balance-sheet weakness.
Indian Bank remains one of the easier valuations to justify among the higher-quality PSBs.
5.6 Union Bank and PNB have become more investable as earnings improve
Union Bank trades at 1.16x book.
Its valuation is slightly higher than FY26, but profitability has improved much more:
ROA: 1.36%
NII growth: 10.1%
Operating profit growth: 15.8%
Its main constraint remains weak deposit growth.
PNB trades at 1.08x book.
Unlike FY26, when the recovery was largely being priced before it appeared, Q1 now shows:
ROA above 1%
Positive NII growth
NNPA of 0.28%
Both are now recovery candidates rather than obvious valuation traps
5.7 Central Bank is the cheapest bank — and the fundamentals are improving
P/B has fallen from 0.96x at FY26 to 0.77x.
At the same time:
ROA improved from 0.89% to 1.00%
Slippage fell from 1.16% to 0.29%
Advances growth accelerated to 28.6%
But operating profit still fell 5.1%, and cost-to-income remains 55.4%.
Central Bank is cheap enough to watch closely, but operating leverage still needs to appear before the re-rating case is complete.
5.8 Bank of Baroda, UCO Bank and PSB are cheap for different reasons
Bank of Baroda trades below book at 0.93x, but operating profit declined and asset-quality trends weakened. The catalyst is still missing.
UCO Bank trades at 1.10x, but ROA is only 0.68%.
PSB trades at 1.32x, despite:
ROA of 0.73%
ROE of 10.85%
Cost-to-income of 60.21%
That looks expensive relative to stronger banks available near or below book.
Valuation Scorecard
Best premium-quality value: Mahabank
Quality at a reasonable price: Indian Bank, Canara Bank
Premium justified by growth: IOB, SBI
Best re-rating candidates: Bank of India, Central Bank
Recovery candidates: Union Bank, PNB
Cheap but catalyst missing: Bank of Baroda
Weak value proposition: UCO Bank, PSB
Mahabank remains the strongest quality-versus-price combination among premium PSBs. IOB’s premium is better supported than at FY26. The biggest valuation change is Bank of India: the stock remains at 0.85x book even after ROA crossed 1%. Canara offers 18% ROE near book value, while Central Bank has become materially cheaper as several operating indicators improve. UCO Bank and PSB remain less attractive because stronger banks are available at similar or lower valuations.
6. The Final Rankings: Public Sector Banks Ranked
The top three remain unchanged from FY26: Mahabank, Indian Bank and IOB.
The main changes are below them. Canara Bank enters at #4. Bank of India moves up after crossing 1% ROA. PNB improves enough to move out of the bottom two. Bank of Baroda slips because operating and asset-quality trends weakened.
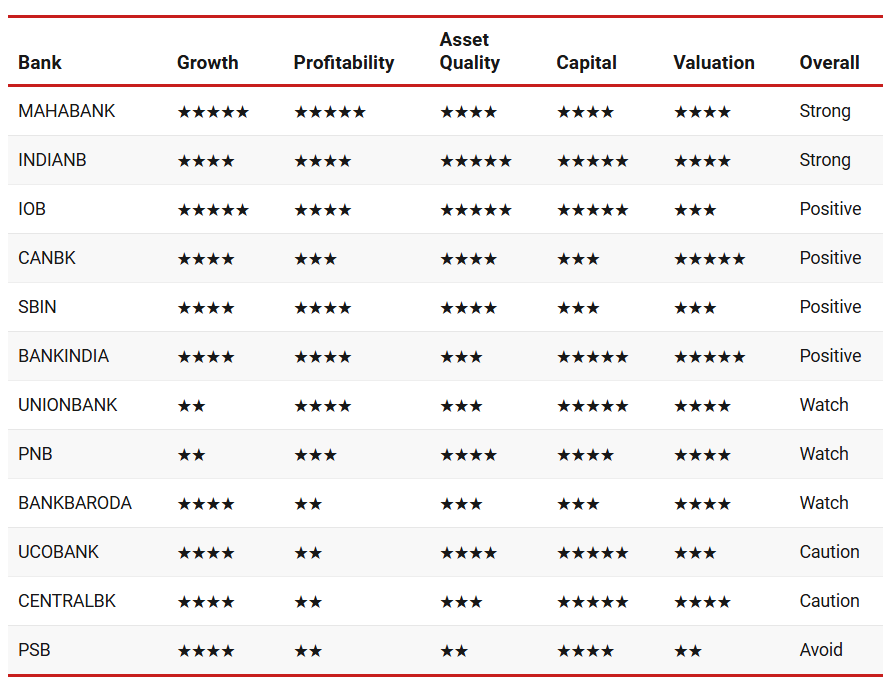
The Verdict on Each Public Sector Bank
🥇 Rank 1: Mahabank — Still the Sector Benchmark
Why it ranks here
Best ROA: 1.90%
Best ROE: 24.65%
Best cost-to-income: 35.0%
Advances growth: 26.9%
NNPA: 0.13%
The valuation also improved slightly, with P/B falling to about 2.02x despite stronger profitability.
Watch: Slippage remains high at 1.23%.
Bottom line: Best overall combination of growth, profitability, funding quality and valuation.
🥈 Rank 2: Indian Bank — The Most Balanced Compounder
Indian Bank continues to deliver strong returns without taking obvious balance-sheet risks.
ROA: 1.31%
ROE: 19.48%
NII growth: 16.9%
NNPA: 0.15%
Advances and deposits both growing around 14%
Watch: Growth is slower than the most aggressive peers.
Bottom line: The cleanest balance between growth, profitability and asset quality.
🥉 Rank 3: IOB — High Growth That Is Still Holding Together
IOB’s main FY26 risk was whether 20%+ loan growth would create bad loans.
So far, it has not.
Advances growth: 22.75%
ROA: 1.41%
ROE: 22.69%
Slippage: just 0.06%
CRAR: 19.36%
Watch: Cost-to-income has risen to 53.95%, and valuation remains high at 2.12x book.
Bottom line: Strong growth, strong returns and exceptional asset quality. The premium valuation is the main constraint.
Rank 4: Canara Bank — Strong Value at Around Book
Canara enters the comparison with a good combination of returns and valuation:
ROA: 1.04%
ROE: 18.31%
Advances growth: 18.0%
P/B: 1.05x
Its weakness is funding: CASA is only 29.7%, the lowest in the group.
Operating profit growth was also weak.
Bottom line: One of the better quality-at-a-reasonable-price options.
Rank 5: SBI — The Anchor
SBI remains one of the most dependable franchises in the group.
Advances growth: 18.63%
ROA: 1.11%
ROE: 17.87%
GNPA: 1.47%
Capital ratios remain lower than peers, but improved during Q1.
At 1.99x book, valuation is full rather than cheap.
Bottom line: Less re-rating potential than smaller PSBs, but much less dependent on a turnaround.
Rank 6: Bank of India — The FY26 Trigger Has Arrived
At FY26, the trigger was simple: ROA needed to cross 1%.
Q1 ROA is 1.01%.
Other indicators also improved:
Operating profit growth: 26.0%
Slippage: 0.24%
CRAR: 18.69%
P/B: still only 0.85x
Watch: One quarter above 1% ROA does not yet prove sustainability.
Bottom line: The strongest deep-value re-rating candidate after Q1.
Rank 7: Union Bank — Earnings Fixed, Funding Not Yet
The profitability problem has improved sharply:
NII growth: 10.1%
Operating profit growth: 15.8%
ROA: 1.36%
But deposits grew only 3.5%, versus 12.5% advances growth.
Bottom line: Earnings have recovered. Deposit growth remains the constraint.
Rank 8: PNB — Recovery Is Now Visible
PNB has improved from FY26:
ROA: 0.89% → 1.04%
NII: -1.9% → +2.1%
NNPA: 0.28%
But GNPA remains high at 2.78%, and core-income growth is still weak.
Bottom line: No longer an obvious valuation trap, but the recovery is still early.
Rank 9: Bank of Baroda — Cheap, But Still Waiting for a Turn
At 0.93x book, Bank of Baroda looks inexpensive.
But Q1 operating trends remain weak:
Operating profit: -1.3%
Fee income: -20.4%
GNPA and slippage both increased
Bottom line: The valuation is attractive. The earnings catalyst is not yet visible.
Rank 10: UCO Bank — Better Efficiency, Still Weak Returns
UCO Bank improved cost-to-income dramatically to 37.5% and remains well capitalised.
But:
ROA: 0.68%
ROE: 10.17%
The improved operating efficiency has not yet translated into acceptable returns.
Bottom line: Progress is visible, but profitability remains too weak.
Rank 11: Central Bank — Getting Interesting
Central Bank has improved materially:
ROA: 1.00%
Slippage: 0.29%
Advances growth: 28.6%
P/B: just 0.77x
But cost-to-income remains 55.4%, and operating profit fell 5.1%.
Bottom line: The valuation is compelling, but operating leverage still needs to appear.
Rank 12: PSB — Improving, But Better Alternatives Exist
PSB’s asset quality has improved:
NNPA: 0.65%
Slippage: 0.18%
But it still has:
ROA: 0.73%
ROE: 10.85%
Cost-to-income: 60.21%
P/B: 1.32x
Several stronger banks trade at lower valuations.
Bottom line: Better than FY26, but still the weakest risk-reward in the group.
The top three remain unchanged: Mahabank, Indian Bank and IOB. Canara enters strongly at #4. Bank of India moves up after crossing the 1% ROA threshold. Union Bank and PNB are improving but still have unresolved weaknesses. Central Bank is becoming an interesting re-rating candidate. Bank of Baroda remains cheap without a clear catalyst, while PSB still offers the weakest value relative to peers.
7. Post Q1 FY27 Questions to Ask Before You Buy A Public Sector Bank
The three checks from FY26 still hold. Q1 FY27 simply changes which banks pass them.
7.1 Is ROA above 1% — and can it stay there?
A 1%+ ROA remains the clearest profitability filter
Do not pay for a recovery until returns actually improve.
7.2 Are deposits keeping pace with loans?
Fast loan growth is useful only if the bank can fund it without steadily increasing its funding cost.
Watch the gap, not just the loan-growth number.
7.3 Does the valuation match the quality?
Cheap stocks are not automatically good investments. Expensive stocks are not automatically bad ones..
Buy the gap between price and fundamentals — not the cheapest multiple on the screen.
The framework remains simple: first check whether the bank earns more than 1% ROA, then whether deposits can support its loan growth, and finally whether the market price already assumes too much. Q1 FY27 strengthens Mahabank, Indian Bank and IOB at the top, while Bank of India and Canara Bank stand out on valuation. The weakest combinations remain banks where low returns are not compensated by sufficiently low prices.
Don’t like what you are reading? Will do better. Let us know at hi@moneymuscle.in
Don’t miss reading our Disclaimer
Excellent Piece Maha Bank was always my top pick, good to see it is still on top. Have you covered the same for Private Sector Banks?