
Best PSB Stocks After FY26 Results: 11 Public Sector Banks Compared
Which public sector bank stocks look strongest after FY26 results? We compare 11 PSBs across growth, ROA, NPA, capital strength and valuation.
We analyze 11 public sector banks based on their FY26 results: SBI, Bank of Baroda, PNB, Union Bank, Indian Bank, IOB, Bank of India, Mahabank, UCO Bank, Central Bank, and Punjab & Sind Bank.
Five sections. One verdict per section. A final ranking at the end.
1. Business Growth
Before you look at profits, look at the engine producing them.
A bank’s business growth — how fast it is growing loans and gathering deposits — tells you whether it is building a durable franchise or simply riding a credit cycle.
Two banks can show identical loan growth numbers. But if one is funding that growth with cheap, stable CASA deposits while the other is scrambling for expensive bulk deposits — they are not the same business.
Three metrics to understand business growth:
Advances growth — is the loan book actually expanding?
Deposit growth — is the funding keeping pace?
CASA ratio and CASA growth — is that funding cheap and sticky?
When all three move together, that is a bank worth owning. When they diverge — that is the red flag hiding in plain sight.
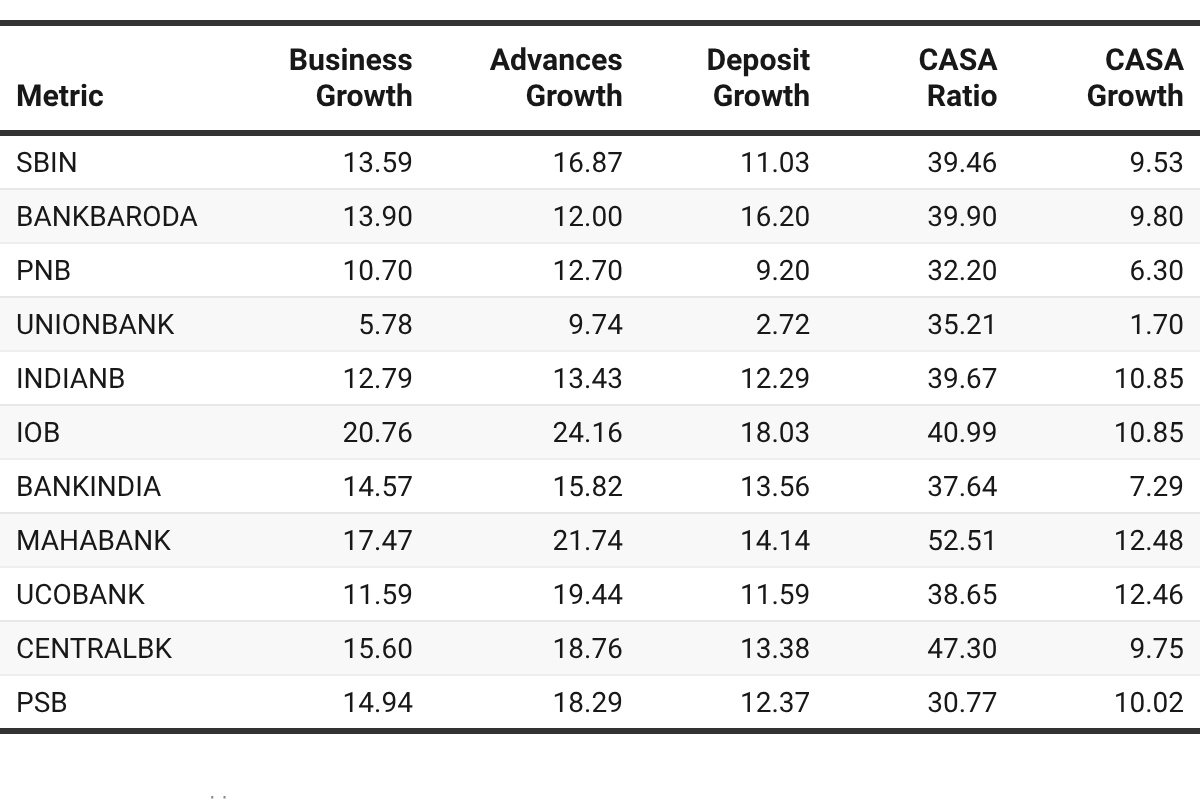
1. IOB’s growth is impressive — but raise an eyebrow.
Advances grew 24.2%. Total business up 20.8%.
That is the fastest in the pack by a wide margin.
But when a bank grows loans 24%, the quality of what it lent matters enormously.
Check back at the asset quality section before getting excited.
2. Mahabank is quietly building the best liability franchise.
CASA ratio of 52.5% — highest in the group. By far.
It also grew that CASA base by 12.5%.
A high CASA ratio that keeps growing means cheap, sticky funding. That is a structural advantage — not a one-year fluke.
Combined with 21.7% advance growth, this is a bank firing on both cylinders.
3. Bank of Baroda made a smart choice.
Loan growth was a modest 12%. But deposit growth was 16.2% — the second highest.
It chose to strengthen its funding base rather than chase loan growth.
That is disciplined balance sheet management. Investors should respect it.
4. Union Bank is the single biggest concern in this section.
Deposits grew just 2.7%. CASA grew 1.7%.
Yet advances grew 9.7%.
A bank growing loans 3.6x faster than deposits is either burning liquidity or paying high rates for bulk deposits.
Both are margin killers. Both show up later in profitability.
5. The CASA story separates long-term compounders from rate-cycle victims.
Mahabank (52.5%) and Central Bank (47.3%) have structurally cheap funding.
PNB (32.2%) and PSB (30.8%) are at the bottom.
In a falling rate environment, high-CASA banks protect NIM. Low-CASA banks suffer.
Mahabank is the standout — quality growth, not just volume growth. IOB gets a conditional star — watch asset quality. Union Bank is the red flag. Its deposit franchise is not keeping pace with its loan book.
2. Profitability — Who Is Actually Earning From Their Growth?
A bank can grow its loan book at 20% and still destroy shareholder value — if its margins are thin, its costs are bloated, and its core income is shrinking. Six metrics tell the full story:
NIM — are they lending at a good spread?
ROA — are assets being sweated efficiently?
ROE — is shareholder capital being rewarded?
Cost-to-income ratio — how much is eaten before profit is made?
NII growth — is the lending business growing?
Operating profit growth — profits from operations before provisioning for bad loans growing?
PAT growth — is the bottom line actually moving?
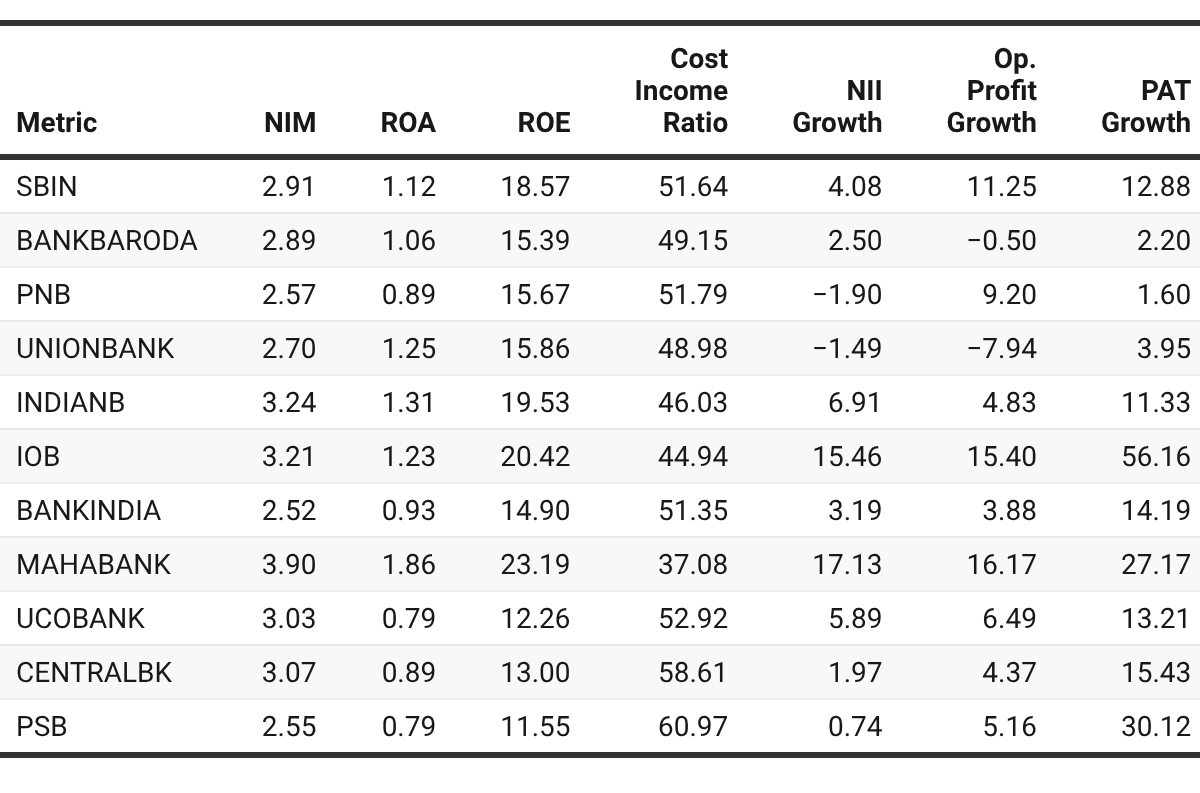
1. Mahabank is the most profitable PSB. It is not close.
ROA of 1.86% and ROE of 23.2% are not just PSB-best numbers.
They are numbers that mid-tier private banks would be proud of.
NIM of 3.9% is a full 100 basis points above the sector median.
NII grew 17.1% and operating profit grew 16.2% — the core engine is compounding, not just the bottom line.
Cost-to-income of 37.1% means it keeps more of every rupee earned than any other bank here.
This is not one strong metric. This is every profitability metric pointing in the same direction.
2. IOB’s 56% net profit growth needs context — and caution.
56% bottom-line growth sounds extraordinary.
But dig deeper: NII grew 15.5% and operating profit grew 15.4%.
The core business is genuinely strong. But a 56% net profit print on 15% operating profit growth implies significant below-the-line tailwinds — lower provisions, treasury gains, or a low base effect.
Structural earnings power? Real, but not 56% real.
3. The ROA threshold that separates quality from mediocrity is 1%.
Above 1% ROA: Mahabank, Indian Bank, IOB, Union Bank, SBI, Bank of Baroda.
Below 1% ROA: UCO Bank (0.79%), PSB (0.79%), Central Bank (0.89%), PNB (0.89%).
Banks below 1% ROA are not generating returns that justify their risk.
Full stop.
4. The cost problem at Central Bank and PSB is structural — not cyclical.
Central Bank spends 58.6 paise of every rupee of income on operating costs.
PSB spends 61 paise. The worst in the group.
This is not a bad quarter. This is overstaffing, underproductive branches, and legacy technology.
PSB’s 30% net profit growth looks impressive until you see its 61% cost-to-income ratio.
You cannot grow your way out of that. The math simply does not work.
5. PNB and Union Bank have a core income problem — and it is getting worse.
PNB’s Net Interest Income fell 1.9% in FY26.
Union Bank’s NII fell 1.5%. Its operating profit fell 7.9%.
Growing a loan book while core lending income shrinks means margins are compressing faster than volume can compensate.
That gap has to close — through repricing or cost cuts. Neither is easy or quick.
6. Non-interest income growth reveals who has a business beyond lending.
SBI grew non-interest income 17.9% — by far the best in the group.
PNB (15.2%) and PSB (13.5%) also showed strong non-interest income growth.
This matters because fee income, insurance, and treasury gains reduce dependence on the credit cycle.
UCO Bank’s non-interest income fell 21.5% — the starkest number in this column. A bank with shrinking fee income and thin NIMs has nowhere to hide when credit costs rise.
Bank of Baroda (-0.2%) and Union Bank (-1.9%) also posted declines — adding to an already concerning profitability picture for both.
7. Bank of Baroda’s profitability is quietly deteriorating.
Net profit grew just 2.2%.
Operating profit actually fell 0.5% — the only bank in the group to report a decline here.
Non-interest income growth is flat at -0.2%.
For a Tier-1 PSB with its balance sheet size, this is underperformance. Not crisis — but a trend that demands attention.
Mahabank is the sector’s most profitable bank — across every metric that matters. Indian Bank and IOB are strong runners-up with genuine earnings momentum. PSB and Central Bank have cost structures that cap their profitability ceiling regardless of growth rate. PNB and Union Bank face a core income squeeze — falling NII is not a rounding error, it is a warning. Bank of Baroda is drifting — solid balance sheet, weakening earnings momentum. UCO Bank’s collapsing non-interest income is the hidden risk most investors will miss.
3: Asset Quality — Whose Clean Books Are Real?
Asset quality is where public sector banks investing has burned investors before. FY26 headline numbers look good across the board. But good headlines can hide fragility.
This section answers the question that separates informed PSB investors from hopeful ones: whose clean books are structurally sound — and whose are one credit cycle away from unravelling?
Five metrics tell the complete picture:
GNPA ratio — how large is the gross bad loan pile?
NNPA ratio — after provisions, what actually remains at risk?
Provision Coverage Ratio (PCR) — how well is the bad loan pile covered?
Slippage ratio — how fast are fresh bad loans forming right now?
Credit cost — how much of this year’s profit is being consumed by provisions?
Read these five together. Any bank that looks good on one but poorly on another is telling you something important.
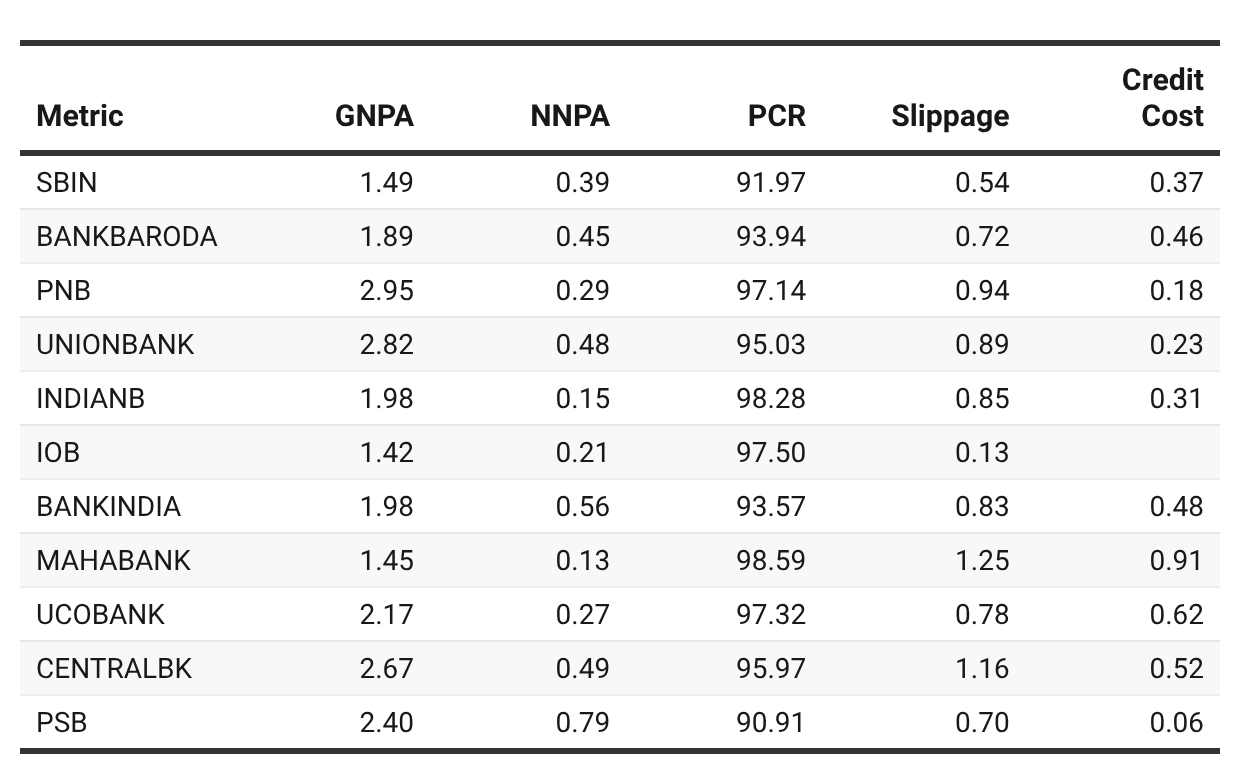
1. IOB’s asset quality is the most impressive number in this entire dataset.
GNPA of 1.42% — lowest in the group.
Slippage of just 0.13% — meaning almost no fresh bad loans are forming.
A bank growing advances at 24% with a 0.13% slippage ratio is doing something genuinely right on credit underwriting.
This single data point substantially validates IOB’s aggressive growth story from Section 1.
2. There is a crucial difference between low GNPA and low NNPA.
GNPA tells you the size of the bad loan pile before provisions.
NNPA tells you the residual risk after provisions — what shareholders are actually exposed to.
PNB has a high GNPA of 2.95% but a low NNPA of 0.29%. Why? PCR of 97.1% — it has provisioned heavily against its bad loans.
The risk is largely covered. The headline GNPA number is scarier than the actual investor exposure.
This distinction matters enormously when comparing banks on a surface level.
3. Mahabank and Indian Bank have the cleanest net books in the sector.
Mahabank NNPA: 0.13%. Indian Bank NNPA: 0.15%.
Both maintain PCRs above 98% — meaning almost every bad loan is fully provided for.
For an equity investor, NNPA is what matters. These two banks have effectively neutralised their NPA risk.
4. PSB is the asset quality outlier — and not in a good way.
NNPA of 0.79% — the highest in the group. By a significant margin.
PCR of 90.9% — the lowest in the group.
Credit cost of just 0.06% — the lowest in the group.
Read those three together: PSB has the most residual bad loan risk, the weakest provisioning buffer, and is making the fewest provisions this year.
That 30% net profit growth from Section 2? A big chunk of it comes from not provisioning adequately.
This is the definition of borrowed profits.
5. Slippage ratios reveal which banks are building tomorrow’s NPA problem today.
Mahabank’s slippage of 1.25% is the highest in the group — and sits in uncomfortable contrast to its pristine NNPA and high PCR.
Fresh bad loan formation at 1.25% means the clean book today is being tested by new stress.
Central Bank (1.16%) is the second-highest. Combined with its 2.67% GNPA, this is a bank where the NPA cleanup is still a work in progress.
IOB (0.13%) and SBI (0.54%) are at the opposite end — very low fresh stress formation.
6. The provision coverage story is the sector’s biggest structural achievement.
Every single bank in this group maintains a PCR above 90%.
In 2019, several PSBs had PCRs below 60%.
This buffer means even if a moderate credit cycle turns, most banks have the provisioning cushion to absorb it without a capital shock.
The sector-wide risk of a 2019-style NPA blow-up is materially lower today. That is a genuine re-rating argument for PSBs as a group.
7. Credit cost tells you who is investing in future safety — and who is harvesting today.
Low credit cost can mean two things: either the book is genuinely clean, or provisioning is being deferred to inflate near-term profits.
PSB’s 0.06% credit cost alongside 0.79% NNPA and 90.9% PCR is almost certainly the latter.
Mahabank’s 0.91% credit cost alongside 0.13% NNPA is the former — it is provisioning aggressively on a clean book, building forward safety.
IOB’s credit cost data is not available — a gap worth noting before building a full position.
The Asset Quality Matrix: A Quick Reference
Clean books + conservative provisioning
Mahabank, Indian Bank, IOB, SBI
These banks have earned their asset quality rating
Elevated GNPA but heavily provisioned
Watch → PNB, Union Bank, UCO Bank
The risk is covered — but the underlying portfolio needs monitoring
Improving but not there yet
Caution → Central Bank, Bank of Baroda, Bank of India
Respectable PCRs but slippage and GNPA still elevated
Weak provisioning on residual risk
Red Flag → PSB
High NNPA + low PCR + low credit cost = profits built on deferred pain
IOB has the cleanest asset quality in the sector — low GNPA, near-zero slippage, strong PCR. Mahabank and Indian Bank have the lowest net risk exposure with NNPA below 0.15%. PSB is the sector’s most dangerous asset quality story — its profit growth is being funded by under-provisioning, not by earnings strength. Central Bank and Mahabank’s slippage ratios are the ones to watch in FY27 — fresh stress is forming even as legacy stress clears.
4. Capital Adequacy — Who Has the Firepower to Keep Growing?
Capital is the fuel that powers a bank’s growth engine.
Without adequate capital, a bank cannot grow its loan book. It cannot absorb unexpected losses. It cannot pay dividends. And when a credit cycle turns — as it always does — an undercapitalised bank does not just underperform. It dilutes shareholders, raises emergency capital at distressed valuations, or worse.
The good news for PSB investors in FY26: the sector is well capitalised. Across the board.
But well capitalised does not mean equally capitalised. And the differences matter — especially if you are trying to identify which banks can sustain high loan growth without needing to come back to markets for capital.
This section answers a critical investor question: which banks have genuine growth headroom — and which are operating closer to the regulatory floor than their headlines suggest?
Three metrics frame the analysis:
CET-1 ratio — the purest measure of equity capital strength. No hybrid instruments. No tricks.
Tier-1 ratio — high-quality capital including Additional Tier-1 instruments.
CRAR / CAR — total capital adequacy including Tier-2 instruments. The regulatory headline number.
The RBI regulatory minimum for CRAR is 11.5% including the capital conservation buffer. Everything above that is headroom. The more headroom, the more a bank can grow without diluting shareholders.
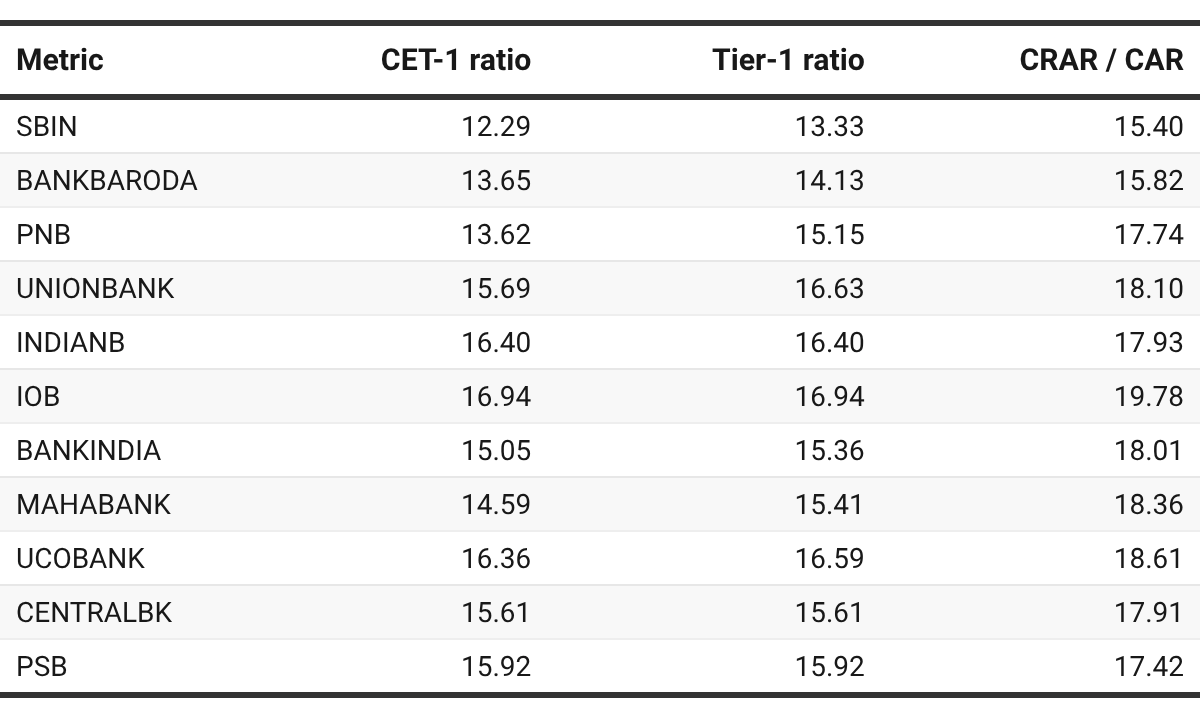
1. The entire sector is above the regulatory minimum. That is the good news.
Every bank here exceeds the RBI’s 11.5% CRAR requirement.
This is a structural improvement from 2018–2021, when several PSBs were dangerously close to — or breaching — capital thresholds.
The government’s ₹3.5 lakh crore recapitalisation programme over the past decade has done its job.
The systemic capital risk that defined PSB investing five years ago is largely off the table.
2. SBI’s lower capital ratios are a feature — not a bug.
SBI’s CET-1 of 12.29% and CRAR of 15.40% are the lowest in the group.
This alarms some investors. It should not.
SBI’s asset base is ₹64 lakh crore — larger than the next four banks combined.
Larger banks structurally operate closer to regulatory minimums because their internal capital generation is enormous in absolute terms.
SBI generated over ₹67,000 crore in net profit in FY26. That is capital being created every single quarter.
The relevant question is not the ratio — it is whether SBI needs to raise equity capital. The answer is no.
3. IOB’s capital position is the strongest in the group — and it changes the growth story.
CET-1 of 16.94%, CRAR of 19.78%, and 8.28% headroom above the regulatory floor.
This is not just comfortable. This is a bank that can grow its loan book aggressively for the next 3–4 years without a single equity raise.
Combined with IOB’s 24.2% advance growth and 0.13% slippage from Section 3 — the capital position gives that growth story a very long runway.
4. Bank of Baroda has the least headroom among the mid-large PSBs.
CRAR of 15.82% gives it just 4.32% above the regulatory floor.
That is the second-lowest buffer in the group after SBI.
Unlike SBI, Bank of Baroda does not have the profit engine to rebuild capital rapidly.
Net profit grew just 2.2% in FY26. Operating profit fell.
A bank with thin capital headroom and weakening profitability has limited room to accelerate loan growth without returning to markets.
This is a constraint that investors in Bank of Baroda need to price in.
5. UCO Bank’s capital ratio deserves a closer look.
CET-1 of 16.36% and CRAR of 18.61% look strong on paper.
But UCO Bank’s ROA is just 0.79% and its non-interest income fell 21.5%.
A bank with weak profitability and high capital ratios is not compounding its capital — it is sitting on it.
High capital ratios built on weak earnings are not a strength. They are a sign that the bank is not deploying capital efficiently.
6. The CET-1 vs Tier-1 gap reveals reliance on AT-1 bonds.
Where CET-1 and Tier-1 are identical, the bank has no Additional Tier-1 (AT-1) instruments outstanding.
IOB, Indian Bank, PSB: CET-1 equals Tier-1. Pure equity capital. No AT-1 dependency.
PNB: CET-1 of 13.62% vs Tier-1 of 15.15% — a 1.53% gap filled by AT-1 bonds.
Union Bank: CET-1 of 15.69% vs Tier-1 of 16.63% — a 0.94% gap.
AT-1 bonds are not equity. They are contingent instruments that can be written down in stress. Investors should not treat Tier-1 as equivalent to CET-1.
7. Capital adequacy and growth ambition must be read together.
The banks growing fastest — IOB (24.2%), Mahabank (21.7%), UCO Bank (19.4%) — need capital to sustain that pace.
IOB is fine. Its 19.78% CRAR gives it years of runway.
UCO Bank’s aggressive loan growth (19.4%) against a backdrop of 0.79% ROA and weak non-interest income raises a question: where does the capital for the next growth leg come from?
Mahabank’s strong ROA (1.86%) means it generates capital internally at a healthy pace — supporting its growth without needing external equity.
Capital Strength vs. Capital Efficiency: The Matrix That Matters
Two banks can have identical CRAR ratios and completely different investment cases:
High capital + High ROA
IOB, Indian Bank
Best of both worlds. Grow and earn.
High capital + Low ROA
UCO Bank, PSB
Capital is idle. Efficiency problem.
Moderate capital + High ROA
Mahabank, SBI
Capital working hard. Self-funding growth.
Low-moderate capital + Low ROA
Bank of Baroda, Central Bank
Constrained. Limited room to manoeuvre.
IOB has the strongest capital position in the group and the most growth runway. Indian Bank and Mahabank combine adequate capital with high ROA — the most sustainable growth profile. SBI’s lower ratios are structural and not a concern given its profit engine. Bank of Baroda has the least mid-large PSB headroom combined with weakening profits — a constraint investors should not ignore. UCO Bank has high capital ratios but is not earning from them — that is an efficiency problem, not a strength.
5. Valuation — Where Is the Market Getting It Wrong?
Two metrics anchor the valuation analysis:
Price-to-Book (P/B) — what the market pays for every rupee of a bank’s net worth. The classic bank valuation metric.
Price-to-Earnings (P/E) — what the market pays for every rupee of earnings. Reveals growth expectations baked into the price.
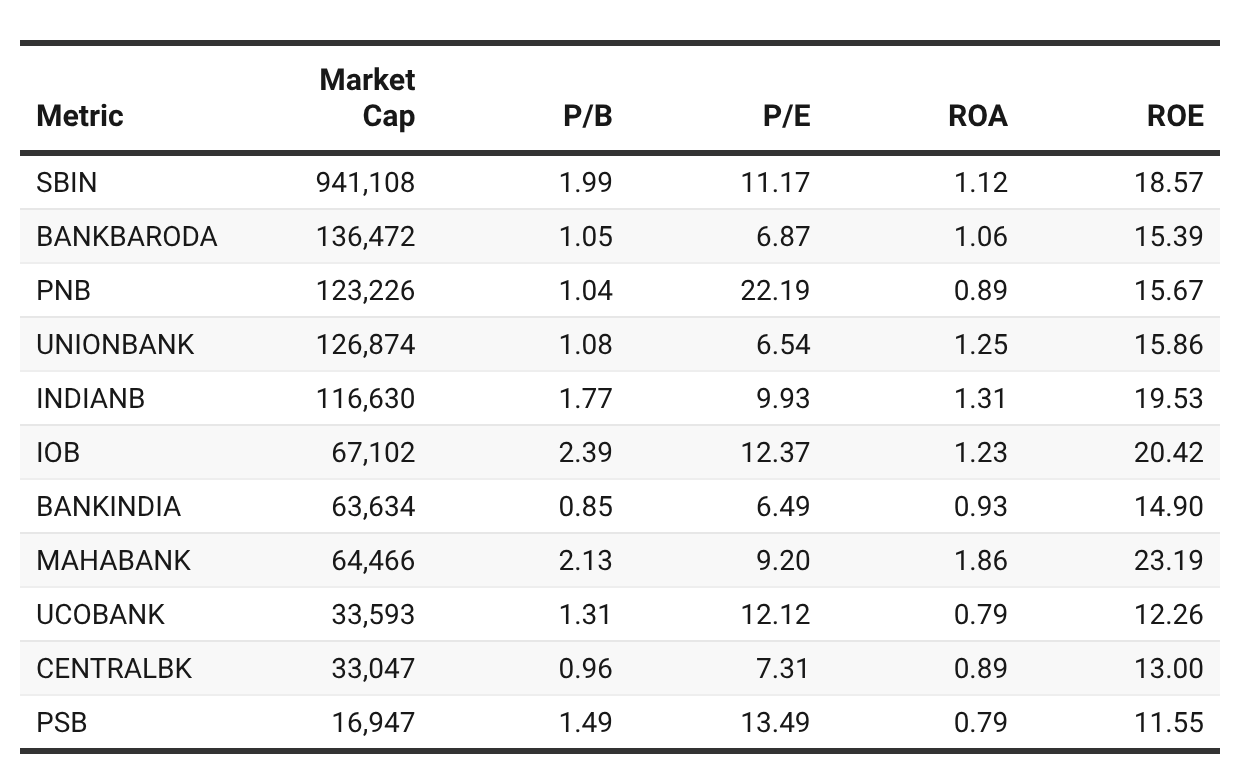
1. Mahabank is the most compelling valuation in this entire dataset.
Best ROA in the sector: 1.86%.
Best ROE in the sector: 23.2%.
Best cost-to-income ratio: 37.1%.
Near-best asset quality: NNPA of 0.13%.
Yet it trades at just 9.2x earnings and 2.13x book.
IOB — with lower ROA, lower ROE, and higher slippage — trades at 12.4x earnings and 2.39x book.
The market is paying a premium for IOB’s growth narrative while underpricing Mahabank’s superior profitability.
That gap is the opportunity.
2. IOB’s premium valuation is partially justified — but priced for perfection.
2.39x P/B is the highest in the group.
IOB earns that premium through: best-in-class asset quality, strong NIM, 20%+ ROE, and explosive growth.
But at 12.4x P/E on a net profit number inflated by below-the-line tailwinds — the valuation leaves little room for disappointment.
If loan growth moderates or slippage ticks up from its near-zero 0.13% — the re-rating works in reverse.
IOB is a quality stock. It is not a cheap one.
3. PNB’s P/E of 22.2x is the most dangerous number in this table.
A bank with 1.6% net profit growth trading at 22x earnings.
NII declining. Operating leverage going the wrong way.
GNPA still at 2.95% — highest in the group.
A 22x P/E implies the market expects a dramatic earnings recovery.
That recovery is not visible in FY26 numbers.
PNB is the clearest valuation trap in the PSB pack.
4. Bank of India at 0.85x book is the deepest value — but value with baggage.
Trading below book value means the market values the bank at less than its net assets.
In theory that is cheap. In practice it reflects: sub-1% ROA, 51% cost-to-income, and an asset quality profile that is improving but not yet clean.
A bank that consistently earns below its cost of equity will always trade below book.
The discount is justified — until ROA crosses 1% sustainably.
Watch for that inflection. That is when the valuation re-rating happens.
5. Bank of Baroda and Union Bank are the market’s forgotten mid-caps.
Both trade near book value: Bank of Baroda at 1.05x, Union Bank at 1.08x.
Both have P/E ratios below 7x — deep value territory on the surface.
Bank of Baroda: solid balance sheet, improving asset quality, but weakening profitability momentum. The low P/B is the market’s verdict on that trajectory.
Union Bank: ROA of 1.25% is actually decent. But deposit growth of 2.7%, falling NII, and falling operating profit tell a story of a bank under internal stress.
Union Bank is the more interesting of the two — if deposit growth recovers, the earnings inflection could be sharp. The 6.5x P/E leaves room for that upside.
6. SBI’s premium is the most rationally justified in the group.
1.99x P/B and 11.2x P/E for the largest bank in India.
ROA of 1.12%, ROE of 18.6%, diversified income, the strongest non-interest income growth at 17.9%.
SBI is not cheap. But it is not expensive.
It is the only PSB with a genuine franchise moat — the insurance subsidiary, the mutual fund business, the YONO platform, the government banking relationships.
You pay a fair price for a bank that will not surprise you negatively.
For conservative investors building a PSB position, SBI is the anchor.
7. PSB’s 1.49x P/B is a valuation anomaly — and not the good kind.
PSB has the worst cost-to-income ratio (61%), the lowest ROA (0.79%), and the highest NNPA (0.79%).
Yet it trades at 1.49x book — above Bank of Baroda, Union Bank, PNB, Central Bank, and Bank of India.
The 30% net profit growth explains the market’s attention. But that profit growth is built on deferred provisioning — credit cost of just 0.06% on an under-provisioned book.
When provisioning normalises, that profit growth disappears.
PSB is the sector’s most overpaid story relative to fundamental quality.
8. Central Bank at 0.96x book deserves a hard look — but not yet a buy.
Trading below book. Cost-to-income of 58.6%. ROA of 0.89%.
Slippage of 1.16% — the second highest in the group.
Capital position is comfortable at 17.91% CRAR.
The bank is improving — net profit grew 15.4%, NII grew marginally positive.
But the cost structure needs to come down materially before this becomes a genuine re-rating story.
A speculative position for investors with patience and high risk tolerance. Not a core holding.
The Valuation Scorecard: Quality vs. Price
The most useful way to synthesise valuation is to map quality against price:
High quality, fair-to-cheap price
Mahabank, Indian Bank
Core holding. Buy and hold.
High quality, full price
IOB, SBI
Own them. Don’t chase them.
Moderate quality, cheap price
Union Bank, Bank of Baroda
Selective. Watch for inflection.
Low quality, cheap price
Bank of India, Central Bank
Only for high risk tolerance. Wait for ROA crossover.
Low quality, expensive price
PSB, PNB
Valuation not supported by fundamentals.
Mahabank is the single most compelling risk-reward in the PSB space — best fundamentals, not the highest price. Indian Bank is the quiet compounder the market has not fully re-rated yet. IOB and SBI are quality names but priced accordingly — own them, do not overpay for them. PNB at 22x earnings is the clearest valuation trap. PSB looks cheap until you realise the profits are partly manufactured. Bank of India and Central Bank are deep value plays that require patience and a clear ROA recovery trigger before committing capital.
6. The Final Rankings: Every PSB Ranked
The Rankings Table
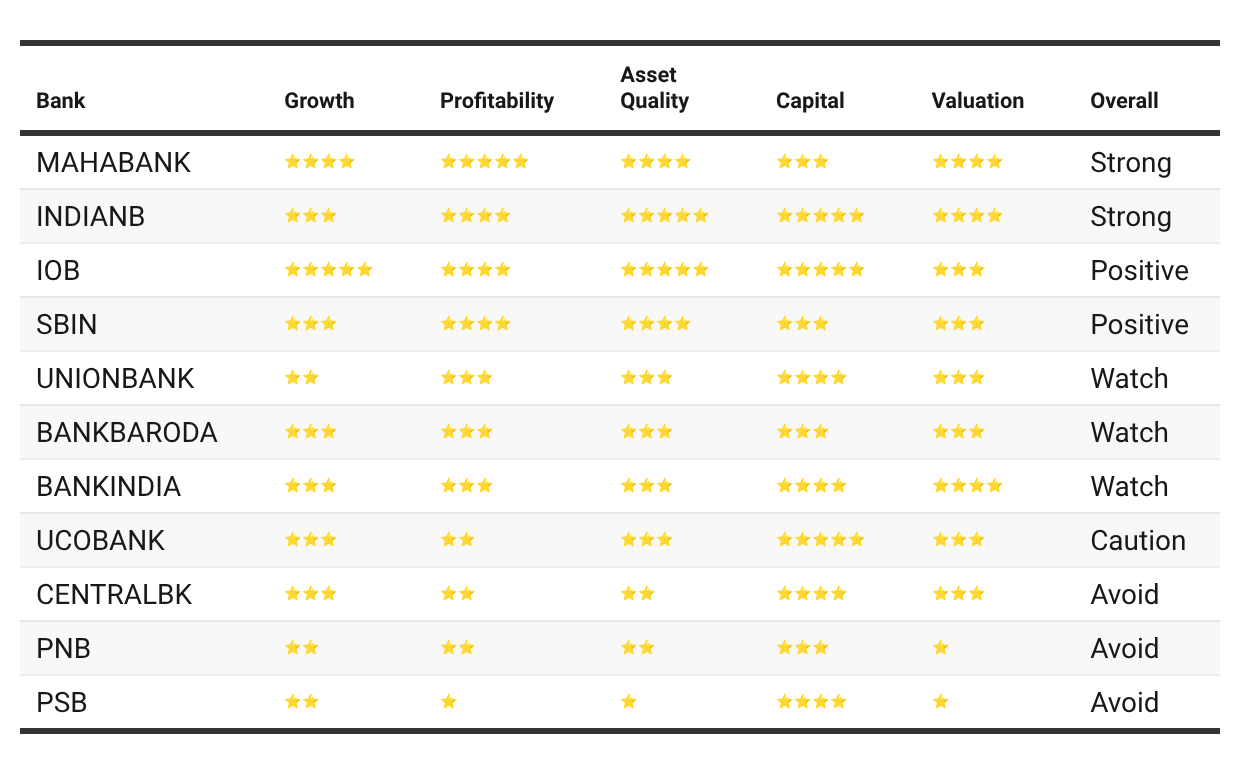
The Verdict on Each Public Sector Bank
🥇 Rank 1: Mahabank — The Sector’s Best Kept Secret
The case for owning it:
Best ROA (1.86%), best ROE (23.2%), best cost-to-income (37.1%) in the entire PSB universe.
CASA ratio of 52.5% — a funding franchise no other PSB comes close to matching.
NNPA of 0.13% — virtually zero net credit risk.
Trades at 9.2x earnings. IOB — with inferior fundamentals — trades at 12.4x.
The one risk to watch:
Slippage ratio of 1.25% is the highest among top-tier PSBs. Fresh stress is forming even as legacy stress clears. Monitor FY27 Q1 and Q2 slippage closely.
Bottom line: Every profitability metric is best-in-class. The valuation has not caught up. That gap is the opportunity.
🥈 Rank 2: Indian Bank — The Quiet Compounder
The case for owning it:
ROA of 1.31% and ROE of 19.5% — consistently strong across multiple years.
NNPA of just 0.15% with PCR of 98.3% — the cleanest net book in the sector.
CET-1 of 16.4% — fortress capital. No equity raise needed for years.
Trades at 9.9x earnings — a discount to IOB despite superior asset quality.
The one risk to watch:
Advance growth of 13.4% is the slowest among top-ranked banks. Indian Bank is profitable — but is it growing fast enough to excite the market?
Bottom line: If Mahabank is the sector’s best kept secret, Indian Bank is the sector’s most dependable compounder. Own it. Be patient.
🥉 Rank 3: IOB — The Growth Story With a Premium Tag
The case for owning it:
Best-in-class asset quality: GNPA 1.42%, slippage just 0.13%.
Strongest capital position: CRAR 19.78% — the most growth runway in the group.
NII grew 15.5%, operating profit grew 15.4% — genuine earnings momentum.
The growth story from Section 1 is validated by the asset quality story from Section 3.
The risks to watch:
24.2% advance growth is the fastest in the sector. Sustaining that without slippage creeping up is the key test.
2.39x P/B and 12.4x P/E — priced for continued perfection. Any disappointment re-rates sharply downward.
Net profit growth of 56% is partly a base effect. Expect that number to normalise significantly in FY27.
Bottom line: A genuinely strong bank — but the valuation asks you to pay up for a story that must keep delivering. High quality. Not high margin of safety.
Rank 4: SBI — The Anchor You Always Own
The case for owning it:
The only PSB with a genuine franchise moat — insurance, mutual funds, YONO, government banking.
Non-interest income grew 17.9% — the best fee income diversification in the group.
Net profit grew 12.9% on an asset base of ₹64 lakh crore. That is exceptional capital generation in absolute terms.
1.99x P/B is full but not stretched for a bank of this quality and systemic importance.
The risks to watch:
CET-1 of 12.29% is the lowest in the group. Not alarming — but limits the pace of balance sheet expansion.
Cost-to-income of 51.6% has room to improve. Private banks operate at 40–45%.
At this size, growth will always be moderate. This is a compounder — not a re-rating story.
Bottom line: SBI is not where you make extraordinary returns. It is where you do not lose sleep. Every PSB portfolio needs an anchor. SBI is that anchor.
Rank 5: Union Bank — Cheap For a Reason. But Watch This Space.
The bull case:
ROA of 1.25% is actually decent — better than Bank of Baroda and several higher-ranked peers on this metric alone.
Trades at 6.5x P/E and 1.08x book — deeply discounted.
CET-1 of 15.69% — well capitalised with room to grow.
Why it is only Rank 5:
Deposit growth of 2.7% is a structural warning. A bank cannot sustainably grow loans 3.6x faster than deposits.
NII fell 1.5%. Operating profit fell 7.9%. Core earnings are going in the wrong direction.
CASA growth of just 1.7% means the cheap funding base is not being refreshed.
The trigger to watch:
If deposit growth recovers to 10%+ in FY27 H1, the earnings inflection could be sharp and the re-rating significant.
At 6.5x P/E, the upside is real — but only if the liability franchise recovers.
Bottom line: Not a core holding today. A high-conviction watchlist name. The deposit growth number is the single metric that will determine whether this becomes a buy.
Rank 6: Bank of Baroda — A Reputation Running On Fumes
The bull case:
Second-largest PSB by assets after SBI. Tier-1 franchise with international operations.
Deposit growth of 16.2% — the liability franchise is being strengthened.
Asset quality is improving. GNPA at 1.89%, PCR at 93.9%.
Why it is Rank 6:
Operating profit fell 0.5% — the only bank in the group to record a decline.
Net profit grew just 2.2%. NII grew just 2.5%.
Non-interest income growth: -0.2%. The fee income engine is stalled.
Lowest capital headroom among mid-large PSBs at just 4.32% above the regulatory floor.
Bottom line: Bank of Baroda is not in crisis. But it is drifting. A bank that is strengthening its deposits but weakening its earnings is consuming its own foundations. Wait for an earnings recovery signal before adding.
Rank 7: Bank of India — Deep Value Waiting for a Trigger
The bull case:
Trades at 0.85x book — the only PSB in this group trading below net asset value.
Advance growth of 15.8%, deposit growth of 13.6% — reasonably balanced.
Net profit grew 14.2% — one of the better bottom-line performances in the group.
Capital position strong at 18.01% CRAR.
Why it is Rank 7:
NIM of 2.52% — the lowest in the group. Thin margins leave no room for error.
NNPA of 0.56% — higher than most top-tier peers.
Cost-to-income of 51.4% needs to come down.
ROA of 0.93% is just below the 1% quality threshold.
The trigger to watch:
ROA crossing 1% sustainably. That is when the market re-rates from 0.85x book toward 1.2–1.3x.
At 6.5x P/E, the upside on that re-rating is meaningful.
Bottom line: Classic deep value. Cheap for real reasons — but those reasons are getting smaller. A speculative buy for investors who can identify the ROA inflection point.
Rank 8: UCO Bank — Capital Rich, Earnings Poor
The problem in one line:
16.36% CET-1 and 19.4% advance growth — but only 0.79% ROA and -21.5% non-interest income growth.
Why that matters:
A bank growing its loan book at 19.4% while earning 0.79% ROA is not compounding shareholder value. It is consuming capital to generate mediocre returns.
Non-interest income collapsed 21.5%. The earnings base is narrow and shrinking.
Slippage of 0.78% is moderate — but credit cost of 0.62% is elevated relative to peers at similar NPA levels.
Bottom line: High capital ratios create a false sense of security. The earnings quality is insufficient to justify meaningful portfolio allocation. Watchlist only.
Rank 9: Central Bank — Improving. Not Enough. Not Yet.
What is getting better:
Net profit grew 15.4%. GNPA has been coming down. Capital is comfortable at 17.91% CRAR.
Trades at 0.96x book — below net asset value.
What is still broken:
Cost-to-income of 58.6% — second worst in the group. Every rupee of income is mostly consumed before profit begins.
Slippage of 1.16% — second highest. Fresh stress is still forming at an uncomfortable pace.
ROA of 0.89% — below the 1% quality floor.
GNPA of 2.67% — still elevated.
Bottom line: The direction is right. The distance left to travel is long. Not a buy until cost-to-income drops below 52% and slippage falls below 0.80%. A bank to admire for its progress — not yet to own for its fundamentals.
Rank 10: PNB — A Valuation Trap Dressed as a Recovery Story
The surface story:
Third-largest PSB by market cap. Brand recognition. Wide branch network.
The reality underneath:
22.2x P/E on 1.6% net profit growth. That is the most expensive earnings multiple in the group — paid for the weakest earnings growth.
NII fell 1.9%. The core lending engine is losing power.
GNPA of 2.95% — the highest in the group.
CASA ratio of 32.2% — near the bottom of the pack.
Operating profit grew 9.2% — but only because provisions fell sharply, not because revenues improved.
Bottom line: PNB is trading on hope, not numbers. The market is pricing in an earnings recovery that the FY26 fundamentals do not support. Until NII growth turns positive and GNPA drops below 2%, this is a name to avoid.
Rank 11: PSB — Profits Built on Borrowed Time
Why it ranks last:
Worst cost-to-income ratio: 61.0%.
Worst ROA: 0.79% (tied with UCO Bank).
Worst ROE: 11.6%.
Highest NNPA: 0.79% — the most residual credit risk in the group.
Lowest PCR: 90.9% — the least provisioned against that risk.
Credit cost of just 0.06% — deferring provisions to manufacture profit growth.
The 30% net profit growth illusion:
PSB’s headline number was 30% net profit growth.
That growth was achieved with a 0.06% credit cost on the most under-provisioned book in the sector.
When provisioning normalises — as it must — that profit growth evaporates.
Meanwhile, you are paying 1.49x book for a bank with 11.6% ROE and 61% cost-to-income.
7. The Three Questions to Ask Before You Buy Any PSB
1. Is the ROA above 1%? Below 1% ROA means the bank is not earning its cost of capital. Everything else is noise until that changes.
2. Is deposit growth keeping pace with loan growth? A bank growing loans faster than deposits for more than two consecutive years is building a liability mismatch. That always resolves — and rarely pleasantly.
3. Is the valuation paying for fundamentals — or for hope? PNB at 22x earnings. PSB at 1.49x book with 61% cost-to-income. The market occasionally prices recovery stories well before the recovery arrives. Make sure you are not the one funding that optimism.
Don’t like what you are reading? Will do better. Let us know at hi@moneymuscle.in
Don’t miss reading our Disclaimer
Just wondering why canara bank is not part of this.. a very useful and easy to understand read, thanks for sharing
Thanks very impressive and easy to understand even for layman.