
Vilas Transcore FY25 Results: PAT Up 48%, Targets ₹ 1,000 Cr Revenue by FY27
Guides 60%+ revenue CAGR by FY27, led by capacity, improving product mix, exports, margin expansion, and potential valuation re-rating from current premium levels.
1. Transformer Lamination, Toroidal Cores, and CRGO Slitted Coils.
vilastranscore.com | NSE - SME: VILAS

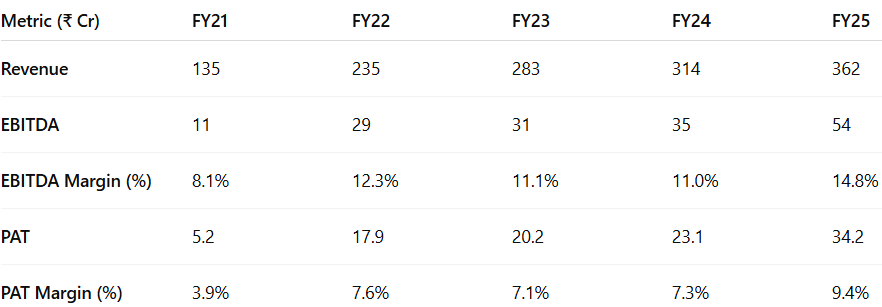
2. FY21-25: PAT CAGR 60% & Revenue CAGR 28%
2.1 Business Evolution: FY21–FY25
Capacity: From 12,000 MTPA (fully utilized) to 36,000 MTPA commissioned in FY25
Product Mix: Moved beyond CRGO laminations to radiators & nanocrystalline cores
Market Reach: Domestic-focused to early-stage exports (Gulf, EU, Canada)
Customer Base: From core OEMs (Voltamp, Electrotherm) to wider infra & energy segments
Capital Structure: Net-debt free, IPO-funded expansion in FY24–25
Execution: Cost control, product diversification, and operating leverage visible
FY26 Ready: Infrastructure in place to scale to ₹ 1,000 Cr revenue
3. H2-25: PAT up 68% & Revenue up 29% YoY
PAT up 39% & Revenue up 20% sequentially
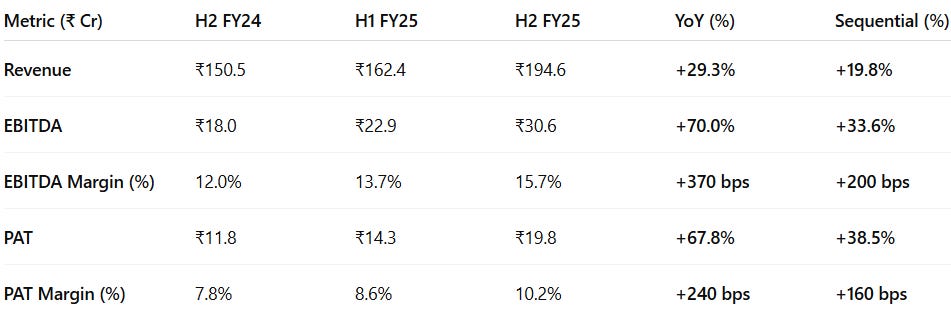
Sequential acceleration across all key metrics signals strong operating leverage.
YoY margin expansion driven by improved cost management, CRGO availability, and improved realization.
H2 FY25 marks highest-ever EBITDA & PAT, supporting a robust FY26 growth outlook.
4. FY-25: PAT up 48% & Revenue up 15%

Strong top-line growth: driven by full utilization and higher volume.
Operating leverage: better scale, stable CRGO prices, and improved mix.
Robust profitability: disciplined cost control and lower finance cost (company remains net-debt free).
Margins at peak levels: Highest EBITDA and PAT margins in company history, laying foundation for FY26 ramp-up.
5. Business Metrics: Strengthening Return Profile
Margin expansion & capital efficiency amid capacity constraints
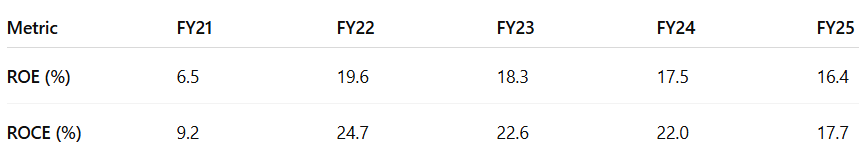
FY22–FY23 Peak Efficiency: Return ratios surged post-COVID as full capacity utilization, strong transformer sector demand, and pricing discipline led to high asset productivity and strong operating leverage.
FY24–25 Investment Phase: Returns have normalized due to IPO-led equity infusion and partial deployment of new capacity (only 50% utilized in FY25). Despite this, return ratios remain resilient, supported by improving margins and a net debt-free balance sheet.
Outlook: ROCE is expected to rebound once the new 36,000 MTPA capacity is fully utilized by FY27, with incremental contribution from high-margin products like nanocrystalline cores and radiators.
6. Outlook: 60%+ Growth in FY26 with 200 bps Margin Expansion
Driven by new capacity, product ramp-up, and demand tailwinds
6.1 FY25 Expectations vs Performance — Vilas Transcore Ltd
✅ Hits in FY25
Robust Revenue Execution: Revenue grew 15% YoY despite capacity constraints, with full utilization (12,069 MT) of legacy plant and no contribution yet from the new facility.
Margin Expansion: EBITDA margin improved by 380 bps to 14.8%, driven by stable CRGO prices, disciplined pricing, and improved product mix.
Strong Balance Sheet: Net debt-free status maintained, with ₹112 Cr cash on books and healthy ROE (16.4%) despite IPO-led equity base expansion.
New Capacity Commissioned: 36,000 MTPA facility (24k lamination + 7.2k radiator + nano cores) entered trial stage in March 2025; commercial production begins Q1 FY26.
Product Diversification: Radiators and nanocrystalline cores lined up to scale in FY26 — both offering significantly higher margins (20–25%).
Customer Base Expansion: Added new marquee clients across transformer and renewable segments; export base widened to Gulf, Europe, and Canada.
❌ Misses in FY25
Capacity Ramp Delay: Commercial operations for new plant delayed from Jan to July due to floods and statutory approvals, capping topline potential.
Working Capital Build-Up: Inventory and receivables rose ahead of capacity scale-up; short-term borrowings increased temporarily to manage CRGO stocking.
Return Ratio Dip: ROCE dropped to 17.7% from 22.0% YoY due to equity base expansion and underutilized new assets.
Export Contribution Still Modest: Exports remained at ~3–4% of revenue; FY26 to see higher traction once new product lines stabilize.
6.2 Outlook for FY26 and Beyond
Aggressive scale-up backed by strong demand visibility and capacity headroom

FY26–FY27: Transformational Growth Phase
And looking to the present market situation and market demand, we don't see big challenge here. I said next year, we will achieve a INR600 crores of turnover. And financial for year '27, INR1,000 crores.
FY26 Guidance: Management reiterated confidence in achieving ₹600 Cr revenue (~66% YoY growth) driven by:
Ramp-up of the new 36,000 MTPA capacity (CRGO laminations + radiators + nanocrystalline cores)
Full utilization of the legacy 12,000 MTPA capacity
Margin expansion through high-value product mix
FY27 Ambition Raised:
Management has now publicly guided for ₹1,000 Cr turnover in FY27 — a 66.7% YoY jump over FY26, indicating:Strong demand visibility across transformer and renewables sectors
High confidence in operational readiness and supply chain execution
Gradual ramp-up in exports and radiator/nano core contributions
Profitability Levers Intact
EBITDA Margin: Expected to stay in the 16.5–17% range as higher-margin products scale
PAT Margin: Management expects 11–12% range, aided by operating leverage and limited capex post-FY26
ROCE: Forecast to rebound to 20%+ as the asset base sweats over FY26–27
Structural Growth Beyond FY27
Targeting leadership in the transformer ancillary ecosystem, offering CRGO, wound cores, radiators, nano/amorphous cores
Export revenue to rise from current ~3% to 15–20% of revenue by FY28
With full capacity likely utilized by FY28, company may explore brownfield expansion or backward integration
7. Valuation Analysis — Vilas Transcore Ltd
7.1 Valuation Snapshot
Assumptions:
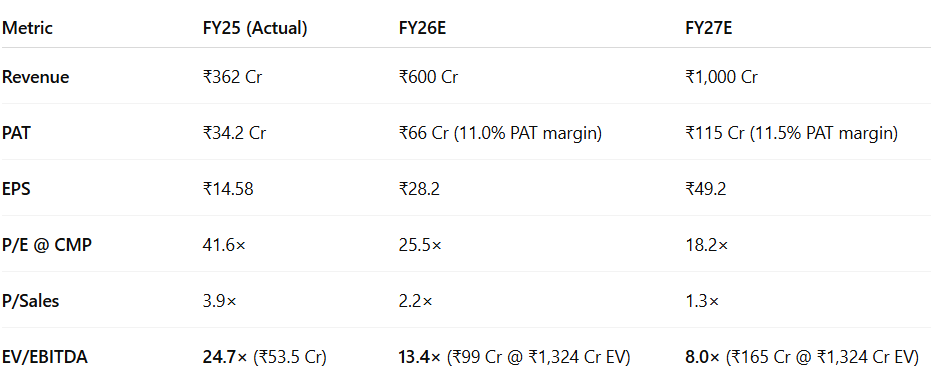
EBITDA Margin: 16.5% (steady across FY26–27, based on margin guidance)
PAT Margin: FY26: 11.0% & FY27: 11.5% (modest expansion from product mix and scale)
Valuations move from expensive (FY25) ➝ fair (FY26) ➝ undervalued (FY27).
Earnings, not re-rating, will drive returns going forward.
Execution of ₹1,000 Cr/₹115 Cr PAT guidance in FY27 justifies further upside.
If management meets its ₹1,000 Cr revenue and ₹115 Cr PAT target in FY27, current valuations may understate the true potential.
7.2 What’s in the Price?
The current valuation (~42× P/E TTM, ~25× forward P/E) reflects high investor confidence in FY26–27 execution.
PAT CAGR of ~48% over FY25–27 and 20%+ ROCE by FY27 are priced in.
Forward EV/EBITDA of 13.4× (FY26) and 8.0× (FY27) implies a valuation premium to transformer ancillary peers.
Implied in valuation:
Execution of ₹600 Cr in FY26 and ₹1,000 Cr in FY27
Ramp-up of radiator + nanocrystalline products
Margins stabilizing at 16.5–17% with high product mix contribution
Working capital normalization by FY27
Full execution is priced in. Any slip in margin, mix, or volume may trigger a de-rating.
7.3 What’s Not in the Price?
Upside triggers remain underappreciated:
Exports: FY27 guidance doesn’t bake in full potential of exports (~15–20% revenue potential by FY28+)
Premium Product Upside: Faster-than-expected scale-up of radiators/nano cores could boost margins above 17%
Amorphous/Nano Core Visibility: New client wins or import substitution could expand addressable market
Brownfield Expansion Optionality: No expansion priced in beyond 36,000 MTPA; possible capacity trigger post-FY27
Valuation Re-Rating: Could move to 28–30× P/E or sub-8× EV/EBITDA if ROCE sustains >24% by FY27
7.4 Risks and What to Monitor
Execution delays or external shocks could derail valuation confidence.
Volume Growth: Deliver > 27k tons sales in FY26
Product Mix: >30% revenue from radiators + nano cores by FY27
UPT/Ramp-Up: 2+ new radiator clients or nano tech wins by FY27
Cost Discipline: Maintain 20%+ PAT CAGR through FY27
CRGO Price Volatility: Spot price spikes could compress margin
Working Capital: Inventory/receivable absorption by FY26
Regulatory Risk: Any changes to transformer input import norms
Vilas offers limited room for execution error — but also strong asymmetric upside if exports, premium products, and volume ramp materialize faster than modeled.
8. Implications for Investors
8.1 Bull, Base & Bear Scenarios — Vilas Transcore Ltd
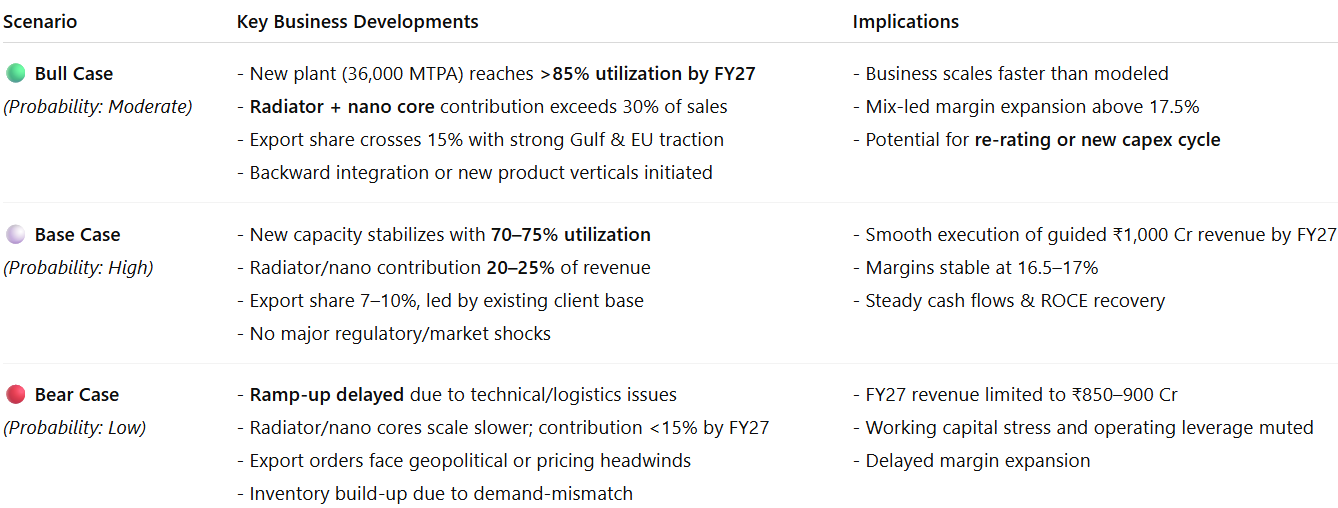
Base Case assumes steady execution of the guided plan — high confidence.
Bull Case unlocks optionality in exports, premium mix, and faster ramp-up.
Bear Case driven by operational delays or external shocks, not structural weakness.
8.2 Is There Any Margin of Safety?
✅ Where There Is Margin of Safety
Business Quality & Model
Long customer relationships with transformer OEMs & utilities
Product mix shift (radiators, nano) adds margin levers
Proven cost control: FY25 EBITDA margin already 14.8%
Capital Structure
Net cash positive: ₹100+ Cr surplus in FY25
IPO-funded expansion; no dilution or leverage risk ahead
Capex behind, asset sweating begins FY26 onward
Execution Levers Not Yet Priced In
Radiator/nano core contribution still minimal in FY25
Faster-than-modeled scale-up could take FY27 revenue to ₹1,100+ Cr
Export ramp and margin kicker (20–25% from radiators) still optionality
Valuation vs Future Earnings
FY27 EPS of ₹49.2 → at CMP, P/E ~18× = 2.5+ years of earnings locked in
EV/EBITDA drops to 8.0× by FY27 — <12× sweet spot for high-quality industrials
❌ Where There Isn’t Much Margin of Safety
Valuation Is Full
Current P/E of 41.6× (TTM) and ~25× forward reflects high expectations
Execution priced in; little room for error or delay
EV/EBITDA of 13.4× (FY26E) implies mid-cycle valuation for a business still scaling
Execution & Market Risks
Radiator mix may ramp slower than expected
Export volumes or CRGO pricing may impact FY26 cash flows
Working capital absorption risk remains (inventory + receivables ↑)
FY25–26 valuation leaves little room for disappointment, but also rewards any upside surprise in margins, exports, or faster ramp.
If Vilas delivers ₹1,000 Cr / ₹115 Cr PAT in FY27, current prices imply limited downside and optional upside — provided execution holds.
Don’t like what you are reading? Will do better. Let us know at hi@moneymuscle.in
Don’t miss reading our Disclaimer
Hi thank you for the write up! Just wanted to check on where has the management guided for 11-12% PAT margin?
Thank you!!