
V2 Retail Q2 FY26 Business Update: Revenue up 86%, On-track FY26 Guidance
Guidance of 40-50% revenue CAGR for the next 4-5 years with stable margins. Valuations discount the growth till FY27. Opportunity if growth plays out for 4-5 years
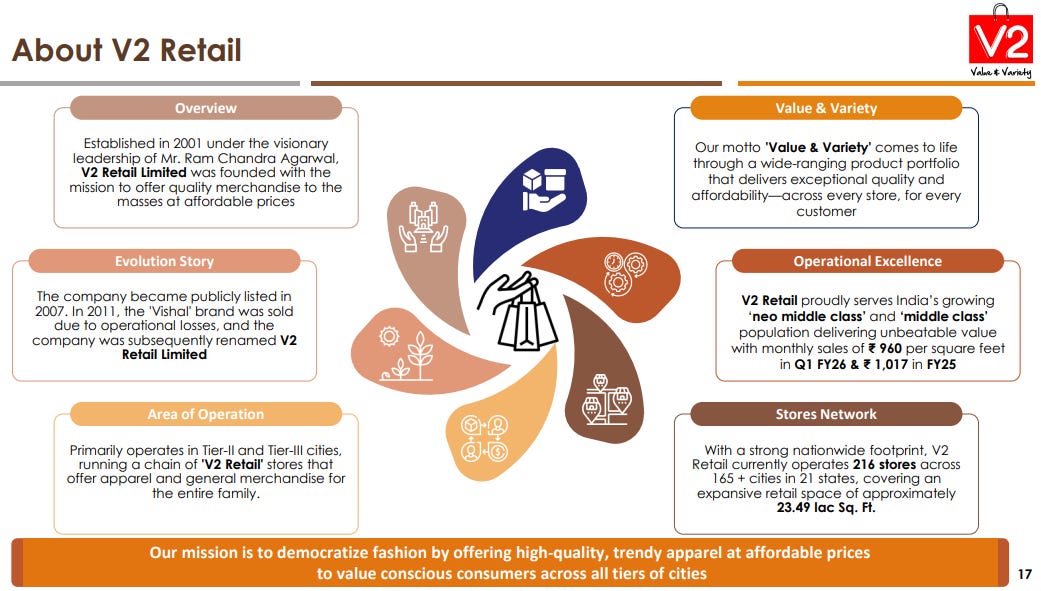
1. Retailer — Fashion Retail Chain
v2retail.com | NSE: V2RETAIL
2. FY21–25: EBITDA CAGR of 52% & Revenue CAGR of 37%
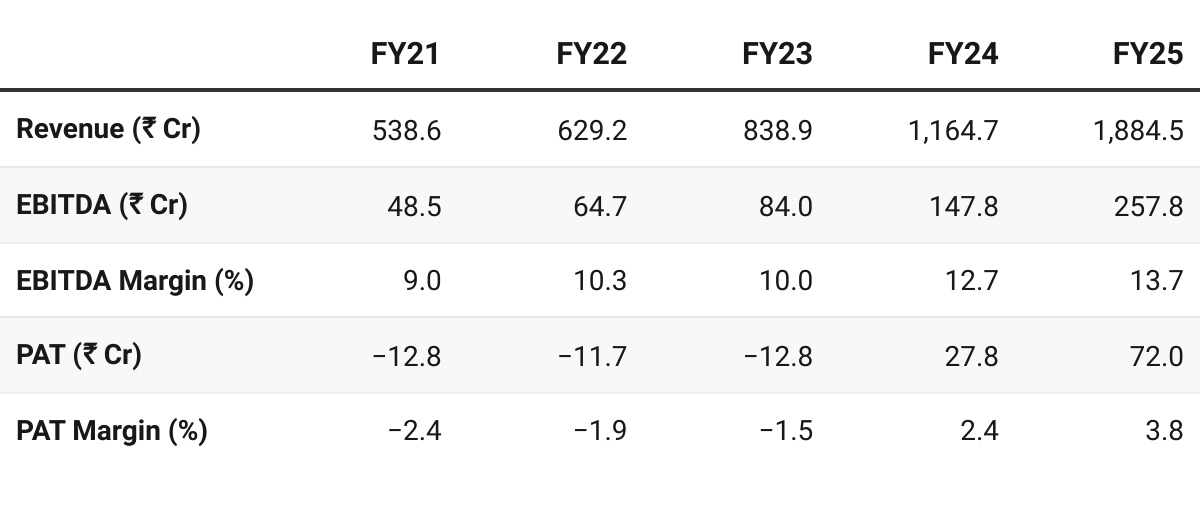
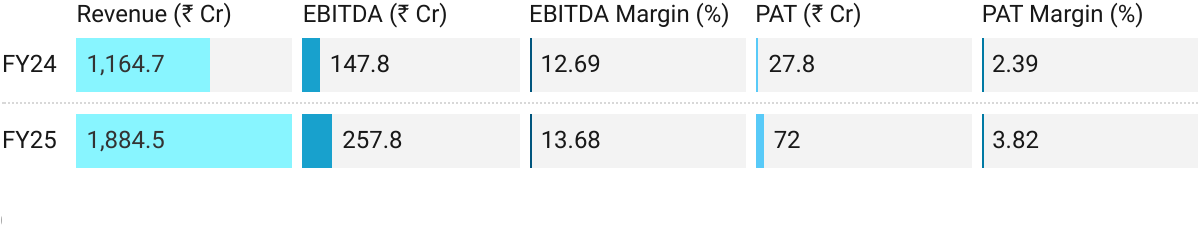
3. FY25: PAT up 159% & Revenue up 62% YoY
Same Store Sales Growth (SSSG): +29% — strong demand and brand traction.
Volume Growth: +43% — robust sell-through supported by wider assortment and better replenishment.
Sales per Square Foot (PSF): ₹1,017/month vs ₹854 in FY24 — 19%
Average Selling Price (ASP): ₹297 up 13% — premiumization & full-price sales
Average Bill Value (ABV): ₹859 up 8% — higher basket size per transaction.
Full-Price Sales Share: 89% of sales (up from 87%) — tighter discount discipline
Net Working Capital (NWC): Improved to 37 days (from 71) — sharper inventory and vendor management
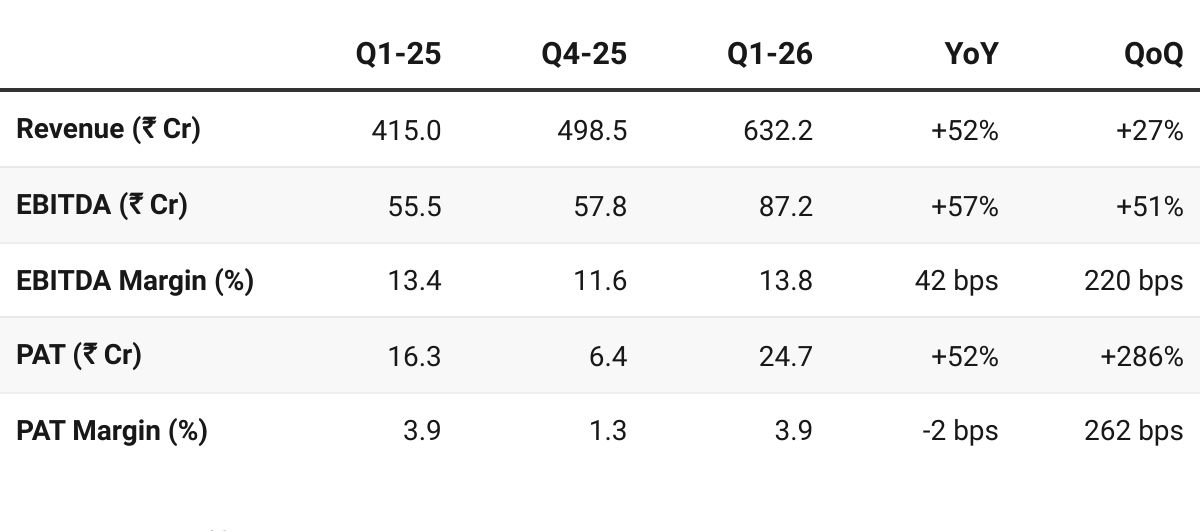
4. Q1 FY26: PAT up 52%, Revenue up 52% YoY
PAT up 286% & Revenue up 27% QoQ
SSSG: Reported –5%, but normalized +10% after adjusting for festival timing; demand steady on a high base.
Volume Growth: +50% YoY — strong throughput and healthy sell-through rates.
Sales per Square Foot (PSF): ₹960/month vs ₹1,061 in Q1 FY25 — a temporary dip due to rapid store expansion and seasonality.
Average Selling Price (ASP): up 17% — better mix and lower discounting
Average Bill Value (ABV): up 9% — higher basket size per customer
Full-Price Sales Share:
92%, slightly lower than 93% YoY but still industry-leading for a value retailer.Store Network: 216 stores (+28 opened, 1 closed)
Revenue Mix: Men’s Wear 41%, Ladies Wear 29%, Kids Wear 24%, Lifestyle 6%
5. Q2 FY26 Business Update: Revenue up 86% YoY
H1 FY26 Revenue: up +68% YoY
Momentum Accelerating
Standalone Revenue: ₹ 705 Cr vs ₹ 380 Cr YoY → +86% growth on a high base.
H1 FY26 Revenue: ₹ 1,334.9 Cr → +68% YoY, — continued operating leverage.
Growth driven by:
Deeper penetration in Tier II/III markets.
Innovation-led assortment and data-driven merchandising.
Faster replenishment and strong sell-through rates.
Key Operating Metrics
Same-Store Sales Growth (SSSG): 23.4% YoY (Reported) / ~10.3% Normalized ~13.3% for H1 FY26 Durga Puja shifted to Q2 → boosted festive base
Sales per Sq. Ft. (per month) ₹ 938 ₹ 948 Stable productivity despite rapid store additions
Strategic & Structural Highlights
Expansion continues cluster-first, focused on Tier 2 & Tier 3 cities — “the next consumption wave.”
Execution discipline maintained:
Limited markdowns indicate strong pricing power and inventory control.
Advanced data-led assortment curation supporting double-digit SSSG.
Strengthened supply-chain efficiency and faster replenishment cycles.
V2 Retail’s Q2 FY26 update shows momentum and disciplined execution despite rapid expansion.
The company is tracking ahead of FY26 growth guidance, reinforcing confidence in its multi-year 40–50% CAGR trajectory driven by value-fashion leadership in India’s Tier II/III markets.
6. Business Metrics: Strong & Improving Returns
7. Outlook: 40-50% Revenue CAGR for 4-5 years
7.1 Guidance
Growth Guidance
What’s next in FY26 & 27, we guide for a revenue growth of 45% to 50% driven by new stores and a same store sales growth of 8% to 10%. We guide for an EBITDA margin at pre-IndAS level of 8% to 9%.
We target a pre-IndAS EBITDA margin of 8% to 9%. So, I think which translates to about 4% to 5% of PAT.
We are always in the lookout for good people because to grow at 40% to 50% for the next 5 years, we need to build a very strong foundation.
To grow at 40%-50% we don’t need additional capital. But because we have been getting such good response of our new stores. We are working on increasing, accelerating the store growth. So, then we might think about raising capital but not debt. It will be equity infusion.
40–50% topline growth in FY26, driven by:
Opening ~100 new stores (vs 74 in FY25; 216 stores by Q1 FY26).
Same-store sales growth (SSSG) of 8–10%, on a high base (FY25 SSG +29%).
Targeting 40–50% annual growth for the next 4–5 years, with expansion concentrated in Tier II/III cities.
Profitability Guidance
EBITDA Margins: So the target is 10%, but anything over 8% is good because even an 8% EBITDA margin gets us a 24%, 25% ROE. But of course the target is to reach 10% in the next 2 years.
PAT Margins: Expected in the 4–5% range.
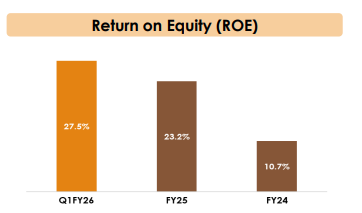
ROE: Maintained around 23–25% (FY25 ROE = 23.2%).
On a pre-Ind AS basis, ROE ≈ 28%.
Store Economics & Capital Efficiency
CAPEX per store: ₹ 1.1 Cr (buildout) + ₹ 1.1 Cr inventory ≈ ₹ 2.2 Cr total.
Payback: ~4 years; store-level ROE ≈ 23–24%.
Break-even: Within 1 month of opening; breakeven sales ₹ 500 / sq ft / month.
Target PSF sales: Raised from ₹ 1,017 (FY25) → ₹ 1,200 (short-term) → ₹ 1,500 (medium-term).
Geographic & Operational Expansion
Rapid penetration in North & East India clusters (UP, Bihar, Odisha, Jharkhand).
New states: Punjab, Rajasthan, Maharashtra (Ichalkaranji store opened FY26), Andhra Pradesh.
Each new store cluster to achieve maturity in 2–3 years; new stores currently deliver ~₹ 750–800 PSF.
Focus on cluster-based expansion, with new zonal warehouses (e.g., Kolkata planned) for logistical efficiency.
Business Model Improvements
85% of our business is private label and we are doubling down on it. Our own design products contributed about 35% to 40% this year and we target it to reach around 60% by the summer of 2026 and 80% by 2027. This means better margins, unique fashion, less discounting and customer loyalty.
Long-Term Strategic Vision
Build a national-scale value-fashion retailer targeting India’s neo-middle-class.
Focus on profitable growth, not just store count.
Emphasizing data-driven demand forecasting, product design innovation, and supply chain automation.
Exploring e-commerce integration (postponed till robust tech platform is ready).
No plans to enter premium segments like Westside or Zudio in near term.
Key risk acknowledged: “poor execution.”
Strong checks introduced (store-level EBITDAs, weekly cash-flow reviews).
V2 Retail enters FY26 from a position of record growth, leaner working capital, and robust profitability.
Management aims for scalable 40–50% growth, sustained 8–9% EBITDA margins, and steady ROE above 20%, anchored on private-label expansion, cluster-based store rollouts, and disciplined execution.
7.2 Q2 FY26 vs FY26 Guidance — V2 Retail
On-track FY26 guidance on revenue growth
Standalone Revenue from operations grew by 68% for the half year ended September 30, 2025.
Same Store Sales Growth (SSSG) of ~13.3% for H1 FY26.
Sales per square feet per month (PSF) at ₹ 948 for H1 FY26
Net addition of 70 (Seventy) new stores with 1 (One) closure during H1 FY26.
We believe that the solid foundation of FY25, coupled with our encouraging performance in H1 FY26, positions V2 Retail for sustained growth and enduring leadership in the value-fashion segment.
Both H1 FY26 and Q2 FY26 revenue growth in-line with the guidance
Store Additions in-line with guidance — 70 added in H1 vs ~100 planned in FY26
Sales per Sq. Ft. (per month): ₹ 938 in Q1 FY26 vs ₹ 948 for H1 FY26 — Stable productivity despite rapid store additions
Q2 FY26 SSSG: 23.4% YoY (Normalized SSSG: ~10.3% adjusted for Durga Puja shift from Q3 to Q2 FY26) — as per guidance of 8-10%
8. Valuation Analysis
8.1 Valuation Snapshot — V2 Retail
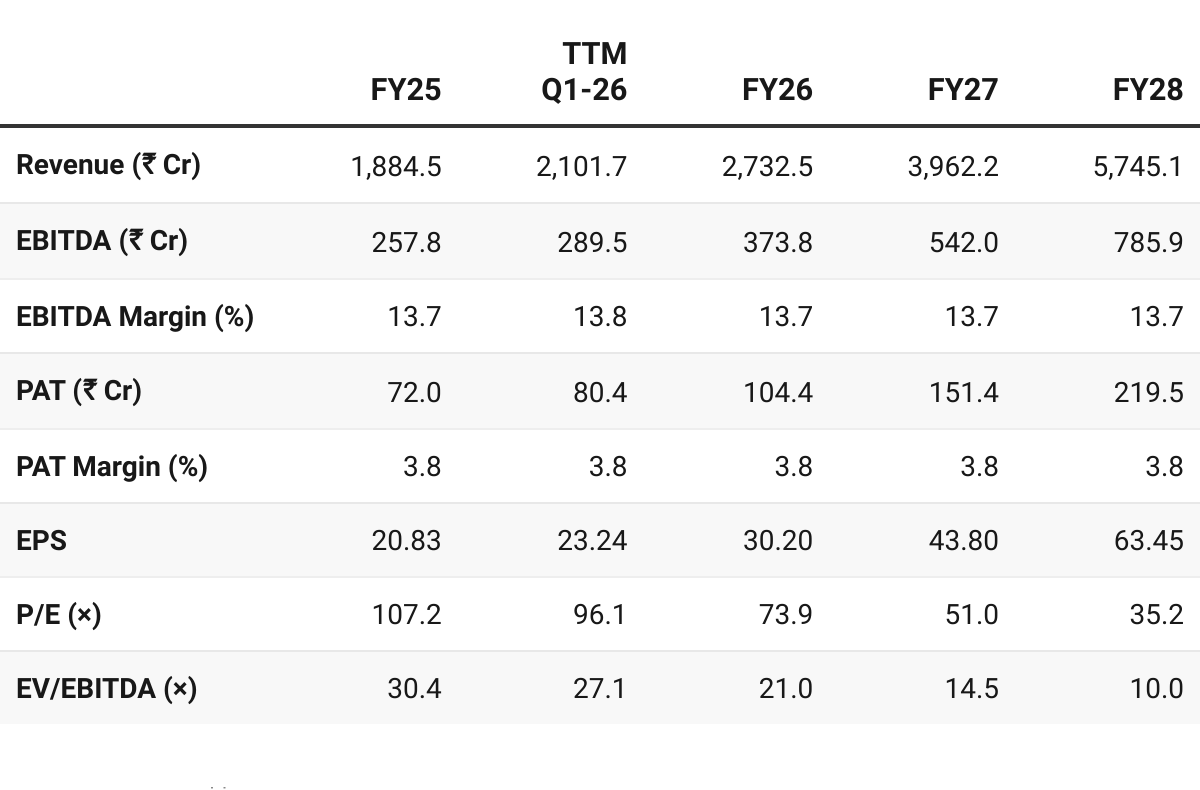
CMP ₹2,233; Mcap ₹7,723.8 Cr;
Valuations assume mid-point of 40-50% growth with stable margins.
V2 Retail = Early-stage Trent for Bharat?
Strong FY26 delivery indicating scalability
At ~74× FY26E P/E, valuation looks rich optically, but PEG < 1.5× for 45% CAGR implies room for further rerating as earnings compound.
Growth up to FY27 discounted in the price — value will emerge if 40-50% momentum continues up to 4-5 years as per guidance
8.2 Opportunity at Current Valuation — V2 Retail
Operating Leverage: The valuation analysis assumes stable margins. An opportunity could be created if operating leverage kicks-in as 40-50% growth momentum is delivered. The management has already guided for EBITDA target of 10% against the 809% guidance for FY26 and FY27
Long-term Growth not Discounted: The guidance of 40-50% growth for the next 4-5 years has been discounted beyond FY27. Considering guidance beyond FY27 requires a lot of trust in the management to deliver as per guidance.
Deep Tier II/III Penetration: By expanding clusters in UP, Bihar, Odisha, Jharkhand, Punjab and Rajasthan, V2 is capturing India’s fastest-growing consumption markets — a segment where organized players remain under-penetrated and provides a runway for growth with limited competition
8.3 Risk at Current Valuation
Limited Opportunity at Current Price: The biggest risk at current prices is that the guidance till FY27 is already discounted in the price.
Execution Strain in Hyper-Expansion: Adding 100 + stores per year tests management depth and operational controls. Any slippage in site selection, cluster logistics, or new-store productivity could dilute margins and ROE.
Seasonality & Festive Volatility: Sales concentration around Q2–Q3 festive cycles (Durga Puja, Diwali, weddings) makes quarterly comparables uneven. A weak festival or delayed onset can compress utilization and PSF metrics.
Working-Capital Sensitivity: Despite improved inventory turns, a 10–15 day stretch in payables or safety stock can absorb 50–70 Cr of cash — impacting free cash flow if expansion pace remains aggressive.
Category & Fashion Cyclicality: Value-fashion relies on fast-moving designs. Missed trends or over-stocking in lower-tier cities can lead to markdowns, eroding the current 29 % gross margin structure.
Execution quality, working-capital discipline, and fashion relevance will determine whether V2 Retail sustains its re-rating curve.
Any deviation from profitable growth > store growth could pause valuation momentum.
Help your group stay ahead. Share now!
Don’t like what you are reading? Let us know at hi@moneymuscle.in
Don’t miss reading our Disclaimer