
Transrail Lighting FY25 Results: PAT Up 40%, Eyes 25% Growth in FY26
Strong order book offers 24-month revenue visibility and margin stability for Transrail, but most of the FY26 execution upside appears priced into current valuations.
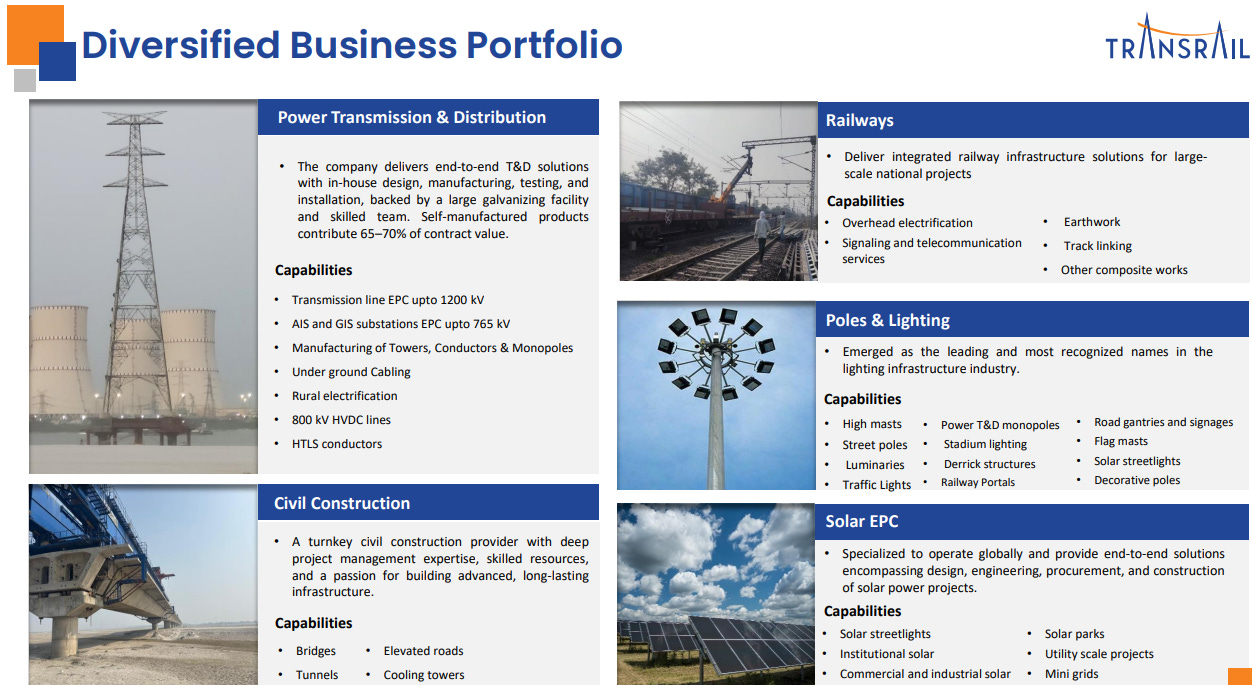
1. EPC Company with Manufacturing of Towers, Conductors & Monopoles
transrail.in | NSE: TRANSRAILL
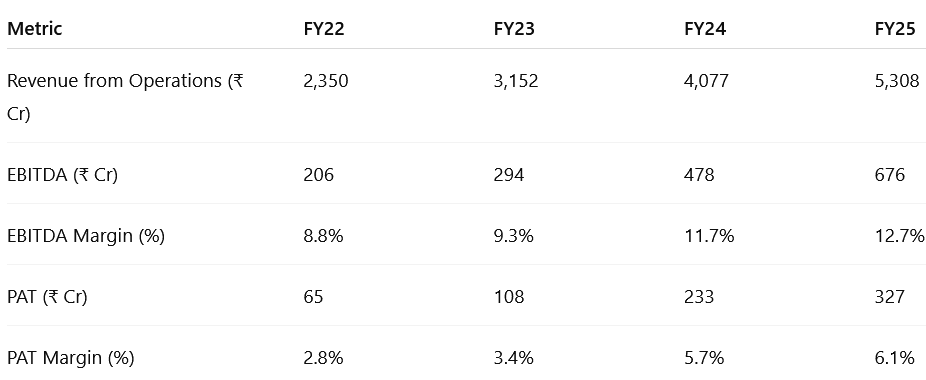
2. FY21–25: Revenue CAGR of 34% & EBITDA CAGR of 37%
2.1 What Changed Between FY22–25
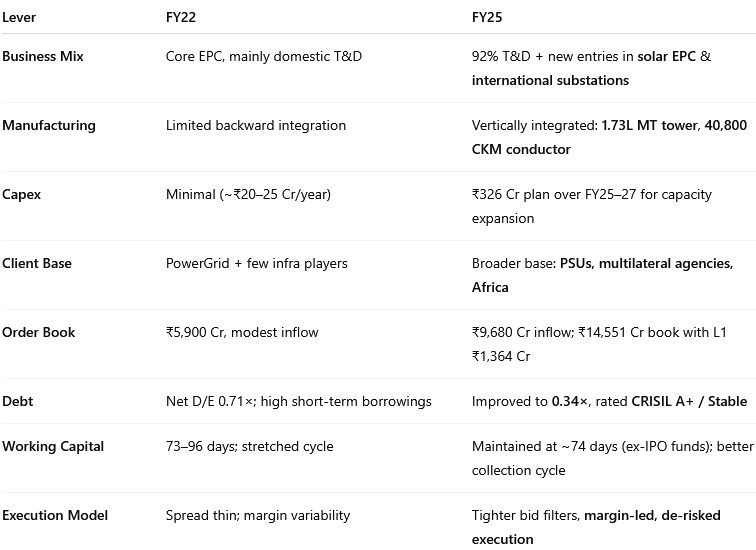
From EPC contractor to fully integrated infra player
From India-centric to balanced global presence
From volume-led to margin-first growth with discipline
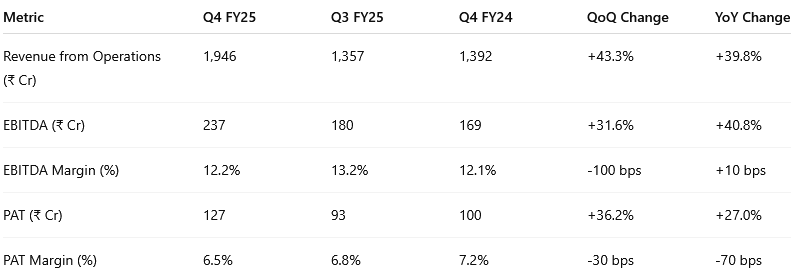
3. Q4 FY25: PAT up 27% & Revenue up 40% YoY
PAT up 36% QoQ & Revenue up 43% QoQ
Bid Selectivity: Focus on profitable geographies and EPC-type jobs
Capex Utilization: Tower & conductor ramp-up began contributing
Execution Peak: ₹580 Cr+ delivered, strong finish to FY25
4. FY25: PAT up 40% & Revenue up 30% YoY
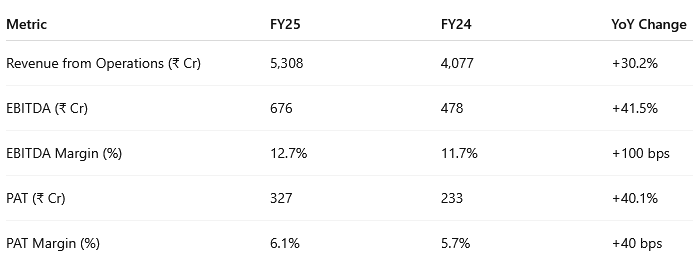
All-Round Growth: Revenue +30%, PAT +40% on steady execution
Margin Discipline: EBITDA uplift backed by design-to-delivery integration and cost discipline
Healthy Balance Sheet: Net D/E down to 0.34×; IPO-funded capex
Order Visibility: ₹14.6K Cr order book ensures 2-2.5 years runway
Model Shift: Fully integrated EPC player with tight capital discipline
5. Business Metrics: Return Ratios Driven by Execution Strength and Capital Efficiency
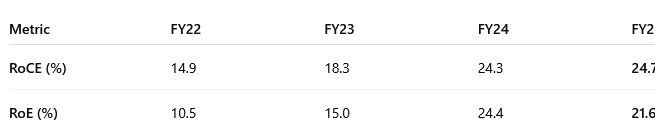
RoCE held steady
Strong execution & high asset turnover post capacity expansion with margin stability from backward integration and tighter bid discipline
6. Strong Outlook: Revenue growth of 60%+ in FY26
6.1 FY25 Expectations vs. Performance
✅ HITS – Transrail FY25
Revenue Growth: FY25 revenue rose 30% YoY to ₹5,308 Cr, driven by strong Q4 commissioning across India, Africa, and Nepal.
Margin Expansion: Consolidated EBITDA margin improved 100 bps YoY to 12.7%, aided by in-house tower/conductor supply and execution scale.
Profit Growth: PAT increased 40% YoY to ₹327 Cr, reflecting operational leverage, lower interest burden, and margin discipline.
Capex Activation: Phase 1 capacity ramp-up underway; Phase 2 expansion funded and aligned to demand visibility in FY26.
⚠️ MISSES – Transrail FY25
Client-Side Delays: Commissioning delays in non-EPC orders due to land acquisition and grid connectivity issues, especially in Q3.
Bangladesh Exposure Risk: Project execution stable, but macro uncertainty led management to reduce future bidding; still ~12% of backlog.
Execution Cost Spike: Q4 subcontracting intensity temporarily elevated cost base, mildly impacting incremental margin flow-through.
6.2 FY26 Guidance – Transrail Lighting
23-25% revenue growth with stable margins in FY26
Order-book gives strong revenue visibility for the next 24 months
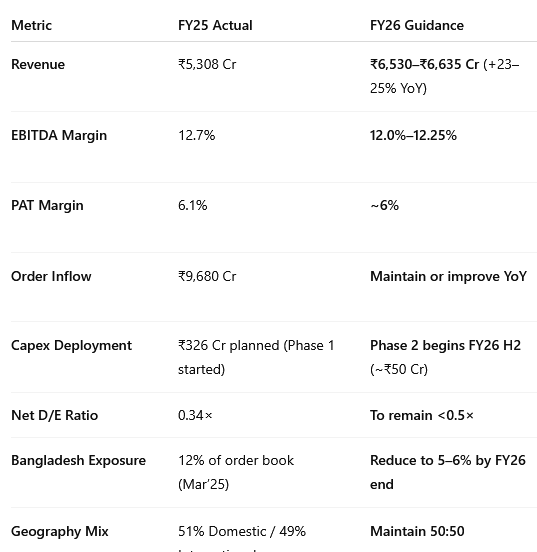
Un-executed Orderbook + L1 of Rs. 15,915 crores as on 31st March 2025 …. which provides us a strong revenue visibility in the next 24 months.
Our guidance is that we will grow our revenue by 23% to 25%
Our guidance remains the same at 12% to 12.25% EBITDA
7. Valuation Analysis
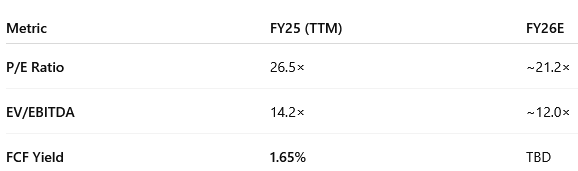
7.1 Valuation Snapshot – Transrail Lighting
Valuation Commentary:
Current multiples — 26.5× P/E and 14.2× EV/EBITDA — reflect strong FY25 delivery: 30% revenue growth, 40% PAT growth, and 24.7% RoCE.
Forward valuations (~21× P/E, ~12× EV/EBITDA) are justified if FY26 guidance is met.
Order book provides an earnings floor; margins look stable at 12–12.25%.
FCF yield at 1.65% is low due to capex, but may rise as working capital normalizes.
Re-rating requires outperformance on execution or margin.
Execution delays or cost overruns in non-EPC projects could compress margins and limit upside.
7.2 What’s in the Price?
Execution Visibility: Market is pricing in full delivery of the ₹14,551 Cr order book at guided growth and margin levels.
PAT Forecast: ~₹400 Cr PAT (~21× forward P/E) is implied assuming no major delays.
Revenue Certainty: 2 years of execution visibility supports earnings stability.
Capital Efficiency: RoCE (24.7%) and RoE (21.6%) justify premium multiples.
Integrated Model: In-house tower/conductor capacity supports margin defense — factored into valuation.
7.3 What’s Not in the Price? (Upside Triggers)
L1 Conversions: Faster conversion of ₹1,364 Cr L1 or new wins in solar/rail EPC can improve revenue certainty for beyond 24 months .
International Mix Upside: Margins improve 1–2% with higher Africa/SAARC share (>49%).
Capex Leverage: Full Phase 2 utilization (FY27–28) could cut subcontracting and raise EBITDA.
Valuation Compression with Growth: PAT >₹400 Cr could justify forward P/E compression to 18–19×.
Working Capital Release: Days outstanding (~74) offer room to unlock cash and improve FCF yield.
7.4 Risks and What to Monitor
Key Risks
Execution Risk: Non-EPC orders may face delays due to land/grid readiness.
Cost Pressure: Subcontracting spike during peak execution can squeeze margins.
Geo Risk: ~49% order book is international; disruptions in Africa/Bangladesh are possible.
Working Capital Strain: Global scale-up may stretch receivables and dampen FCF.
Client Concentration: Heavy dependence on PGCIL and multilateral agencies limits pipeline diversity.
What to Monitor
L1 Conversion: Timely execution of ₹1,364 Cr L1 is key to meeting targets beyond FY26.
EBITDA Margin Stability: Holding 12–12.25% margin range amid cost fluctuations.
Bangladesh Exit: Smooth wind-down to 5–6% of backlog without execution spillover.
Capex Absorption: Phase 2 ramp-up and utilization into high-margin orders.
Free Cash Flow: Sustained improvement in FCF yield signals execution efficiency.
8. Implications for Investors
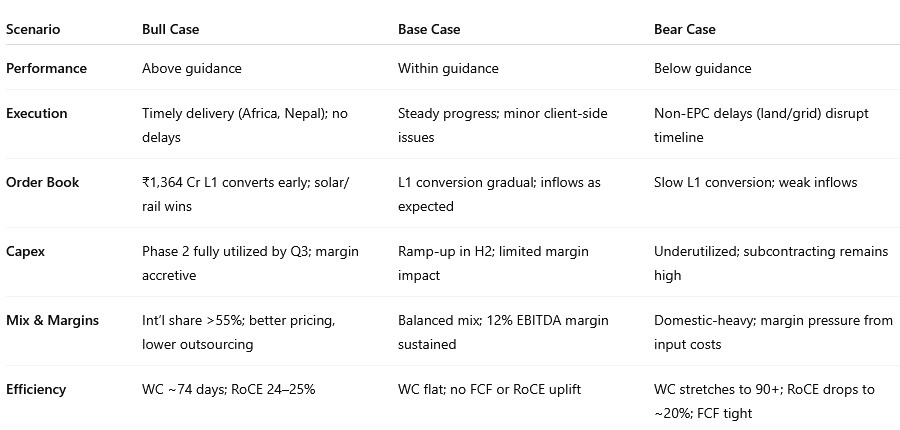
8.1 Bull, Base & Bear Case Scenarios – Transrail
8.2. Overall Margin of Safety: Low to Moderate
Transrail Lighting offers a low-to-moderate margin of safety. Strong RoCE, execution visibility, backward integration, and a lean balance sheet underpin quality — but much of the FY26 upside is already embedded in current valuations.
What the Market Has Priced In:
FY26 visibility (~₹6,530–6,635 Cr) backed by ₹14,551 Cr order book + ₹1,364 Cr in L1.
Base-case PAT of ₹390–400 Cr, assuming 23–25% growth and ~6% PAT margin.
EBITDA margin >12%, supported by in-house tower/conductor capacity.
No working capital upside or free cash flow re-rating yet.
Valuation fully reflects execution: ~21× forward P/E, ~12× EV/EBITDA — leaving little room for multiple expansion.
Upside Optionality (Not in the Price):
L1 Order Conversion: Quick conversion could lift revenue visibility.
International Mix Benefit: 1–2% higher margins if Africa/SAARC share increases beyond 50%.
Capex Leverage: Phase 2 ramp-up could reduce subcontracting and lift margins in FY27.
Working Capital Gains: WC days (~74) offer FCF upside; yield may improve from 1.65%.
P/E Re-rating with PAT Growth: ₹400+ Cr PAT may justify P/E compression from 21× to 18–19×, improving risk-adjusted returns.
Downside Protection Factors:
Order Book Visibility: 2+ years of secured revenue execution.
Integrated Manufacturing: In-house supply ensures cost control even under inflation.
Deleveraged Capital Structure: Net D/E at 0.34× lowers financial risk.
High RoCE Profile: >24% RoCE supports capital efficiency under base-case outcomes.
Selective Bidding Discipline: Multilateral and PSU-focused order mix limits execution and credit risk.
Bangladesh Exit Strategy: Controlled wind-down from 12% to 5–6% reduces geopolitical exposure.
Don’t like what you are reading? Will do better. Let us know at hi@moneymuscle.in
Don’t miss reading our Disclaimer
In depth analysis as usual