
Tinna Rubber FY25 Results: PAT up 20%, Vision 2028 Targets ₹1,000 Cr Revenue
PAT CAGR of 33%+, Revenue CAGR of 25%+ for FY25-28 to deliver ROCE of 30%+. Premium valuations in the short-term provide opportunity over the longer term.
1. One of the Largest Indian End of Life Tyres (ELT) Recyclers
tinna.in | NSE: TINNARUBR

2. FY21-25: EBITDA CAGR of 45% & Revenue CAGR of 40%

2.1 Business Transformation: FY21–FY25
Diversified from rubber recycling into bitumen products, steel abrasives, and engineered plastics.
International footprint established: Oman (operational), Saudi Arabia and South Africa (under development).
Segmental revenue now spans Infrastructure (48%), Industrial (22%), Steel (13%), Consumer (7%).
Added new products: micronized rubber powder, masterbatch, polymer composites, steel abrasives.
Tire crushing capacity scaled from 1,00,000 MTPA in FY22 to 1,85,000 MTPA in FY25.
Commissioned solar power system in FY25, generating ₹6.5 Mn in energy savings.
Monetized ₹26 Cr in EPR credits; 28% YoY export growth.
Capex of ₹50 Cr completed in FY25; planning ₹100 Cr over next 2 years.
QIP of ₹125–150 Cr planned to fund carbon black plant and expansion.
3. Q4-25: PAT down 25% & Revenue up 17% YoY
PAT up 43% & Revenue up 5% QoQ

Saudi JV (Tinna Rubber Arabia Ltd.) incorporated; 24,000 TPA plant scheduled for H2 FY26 commissioning.
South Africa JV received permission to export 24,000 ELTs to India; operations to start Q1 FY26.
Varale plant (Maharashtra) contributed ₹58 Cr to FY25 revenue; operated at ~55% capacity.
Polymer Compounding (PC & MB) business contributed ~₹50–60 Cr to FY25 revenue; full ramp-up expected in FY26.
4. FY25: PAT up 20% & Revenue up 40% YoY

Strong execution across infrastructure, exports, and global operations
Global expansion gained momentum: Oman at 85% utilization; Saudi and South Africa plants progressing toward FY26 ops.
Volume growth across all key segments: Tyre processing +35%, steel +95%, industrial +46%, consumer +58%.
Exports up 28% YoY, with strong traction in GCC and Europe for high-grade recycled rubber.
₹50 Cr capex completed; another ₹100 Cr planned over next two years, funded via QIP and internal accruals.
Despite margin normalization, FY25 posted record topline and highest-ever PAT, supported by scale and operating leverage.
5. Return Metrics: ROE & ROCE Near Target of 30%
Capital Efficiency, Operating Leverage, and Expansion Without Dilution
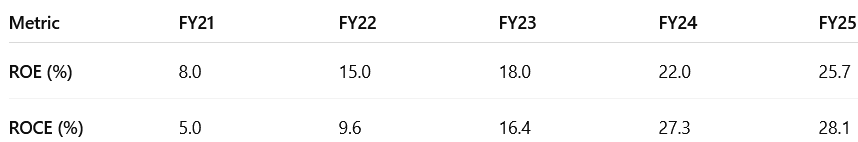
FY25 return metrics remain strong, supported by scale-led efficiencies and disciplined capex execution.
Margins held firm at ~15% EBITDA despite freight pressures; working capital cycle improved to 42 days (from 62 in FY22).
₹125 Cr QIP planned to fund growth without debt strain, while maintaining return ratios above 25%.
Tinna aims to reach 30%+ ROCE by FY28, driven by full ramp-up of Varale, carbon black plant, and global operations.
6. Outlook: Vision 2028 — 25% Revenue Growth, 33% PAT Growth
6.1 FY25 Expectations vs Performance
✅ HITS – What Went Right
Revenue Beat: Actual: ₹505.3 Cr vs Guidance: ₹500 Cr. Surpassed full-year revenue target with 39% YoY growth.
Strong PAT and EBITDA Growth
PAT +20% YoY & EBITDA +22% YoY. Maintained double-digit profitability despite cost pressures.
Capacity Expansion
Tire crushing capacity: Scaled up to 1,85,000 MTPA, beating prior guidance of 1,50,000 MTPA.
On track for 2,50,000 MTPA by FY27.
Varale Plant Ramping Up
Contributed ₹58 Cr to FY25 topline at just 55% utilization.
Ready for major ramp-up in FY26.
New Revenue Streams Initiated
Polymer Compounding (PC & MB): Contributed 1% to topline; targeting ₹30–₹40 Cr in FY26.
Steel Abrasives: 5,000 tons added; steel segment grew 109% YoY.
International Execution
Oman: Running at 85% capacity; contributed ₹20 Cr PAT.
Saudi & South Africa: Projects progressing toward FY26 commissioning.
Working Capital Efficiency : WC days: Reduced to 42 days, down from 62 in FY22
Return Ratios: Strong capital efficiency, approaching Vision 2028 targets.
❌ MISSES – What Fell Short
EBITDA Margin Compression: FY25 — 15.1% vs FY24 — 17.2%
Margin decline due to elevated ocean freight and raw material costs.
Capex Spending Behind Fundraising
₹125 Cr QIP being raised, even though planned capex is ₹100 Cr.
Management clarified it’s to build "firepower" for possible inorganic growth, but raises questions on dilution efficiency.
Recovered Carbon Black Plant – Delayed Disclosure
Strategic project still lacks timeline, capex clarity, and location.
Delays in formal announcement, despite high investor interest.
Slight Guidance Revision
Earlier guidance was ₹900 Cr revenue by FY27, now reset to ₹1,000 Cr by FY28.
Indicates a one-year shift in revenue scale-up expectations.
Tinna delivered an impressive FY25 on revenue, execution, and capacity scaling. Margin pressure and some softness in forward visibility (esp. carbon black plant) are worth monitoring, but the core story of sustainable growth + global scale-up remains intact.
6.2 Future Outlook: Vison 2028 of Tinna Rubber & Infrastructure
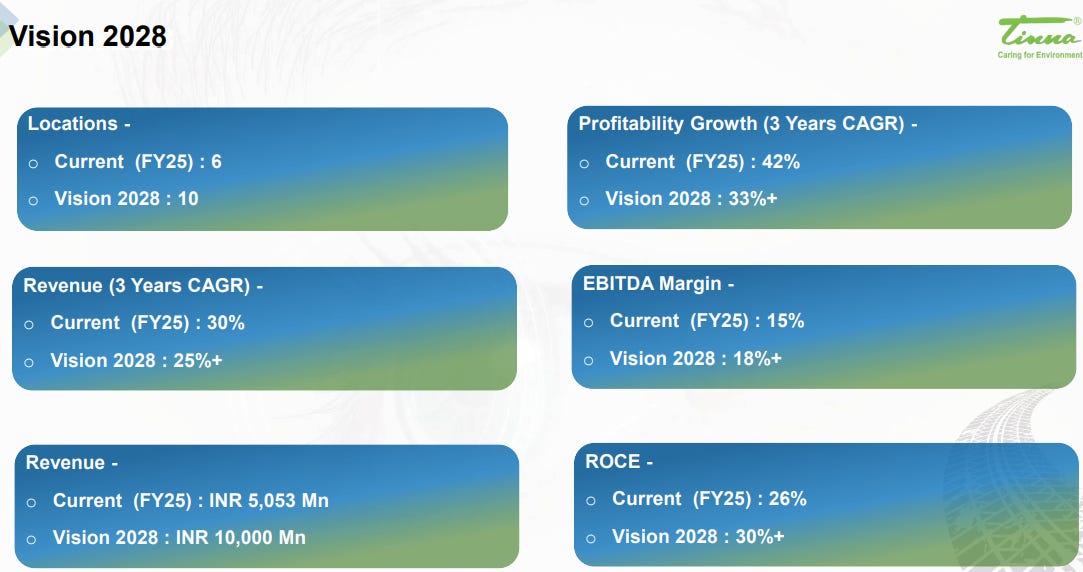

Strategic Growth Drivers
Capacity Expansion
Tire crushing capacity grew to 1,85,000 MTPA in FY25; targeting 2,50,000 MTPA by FY27.
Major ramp-up expected at Varale plant, which operated at 55% utilization in FY25.
New Revenue Streams
Recovered Carbon Black Plant: ₹100 Cr capex planned over 2 years, supported by ₹150 Cr QIP. Location and technology under finalization.
Polymer Compounding (PC & MB): Contributed 1% of topline in FY25; targeting ₹30–40 Cr revenue in FY26.
Global Expansion
Oman: Operating at 85% utilization. No further expansion due to ELT availability limits.
Saudi Arabia: 24,000 MTPA plant targeted for commissioning in H2 FY26.
South Africa: Infrastructure work underway; operations expected Q1 FY26. Focus on importing ELTs to India.
Infrastructure Play
Government push toward CRMB and modified bitumen opens long-term growth. Tinna enjoys leading market share in this niche, with margins above company average.
FY26 Guidance
Revenue Growth: 25% YoY expected
Major uplift from Varale plant, full-year PC & MB ramp-up, and steel abrasives growth (defense demand).
7. Valuation Analysis
7.1 Valuation Snapshot — Tinna Rubber & Infrastructure

P/E Multiple – Valuation Compressing Rapidly
FY25 P/E of 32.8× appears high — but reflects investment phase (capex, expansion).
P/E compression signals undervaluation if PAT delivery materializes. The stock can re-rate even if the price stays flat.
EV/EBITDA – Attractive on Operating Earnings
FY25 EV/EBITDA: 38.6× looks expensive, but EBITDA is expected to more than double by FY28.
By FY28, EV/EBITDA drops to 16.3×, reflecting much stronger cash generation.
Despite flat EV, operating leverage pulls valuation down, suggesting significant upside in core operating efficiency.
P/S – Reflects Revenue-Scale Undervaluation
P/S drops from 3.3× to 1.67× by FY28 — signaling price is not yet reflecting the revenue potential.
For a business with >15% EBITDA margin and 25% revenue CAGR and a ROCE of 30%, a P/S < 2× is compelling.
Strong top-line growth with stable margins is not fully priced in. Stock appears undervalued on revenue and sales-based multiples.
Overall
Valuation Compression All multiples compress sharply by FY28 if guidance is met
Upside Potential High — even if stock doesn’t re-rate, earnings expansion alone supports it
Tinna trades expensively on current earnings, but is an opportunity relative to its FY28 potential.
7.2 What’s in the Price?
The current valuation — 32.8× P/E (FY25 TTM) and ~26× forward P/E (FY26E) — reflects investor confidence in execution, but not full visibility of long-term margin and scale potential.
PAT CAGR of ~33% (FY25–FY28) is management guided, implying the stock trades at a reasonable PEG (~1.0×).
EV/EBITDA of 30.8× (FY26E) embeds early-stage scaling costs and signals premium pricing relative to legacy rubber peers.
Implied in Valuation:
Execution of ₹631 Cr revenue in FY26 with margins held around 15% EBITDA / 9.6% PAT.
Initial operating leverage from capacity expansion and existing plant utilization.
Working capital efficiency sustained at ~42 days.
No significant upside from carbon black or international JVs (Saudi/South Africa) yet assumed.
Conservative monetization from EPR and solar savings modeled in.
⚠️ Any miss in volumes, pricing power, or expansion pace could compress multiples quickly.
7.3 What’s Not in the Price?
International Expansion Optionality: Oman at 85% utilization already profitable; Saudi & South Africa to ramp in FY26–27. Minimal contribution baked in.
Carbon Black Monetization: Capex of ₹100 Cr over 2 years is not factored into FY26 numbers. Once operational, it could improve margins and reduce raw material dependency.
Polymer Compounding: PC & MB only contributed ~₹50–₹60 Cr in FY25. Management expects it to grow to ₹100–₹150 Cr by FY27–28.
Steel Abrasives Ramp-Up: Newly added product line has 90%+ YoY growth; high-margin and defense-linked.
Re-rating Potential: If Tinna achieves ₹1,000 Cr topline by FY28 with 10%+ PAT margin, P/E could compress to 15–18×, implying a sharp re-rating window.
7.4 Risks and What to Monitor
Saudi/South Africa Delays: Execution risks around land acquisition, regulatory clearance, or import logistics could defer global contribution beyond FY26.
Carbon Black Capex Risk: Any delays or cost overruns in pyrolysis plant or tech adoption could limit the expected boost to margins.
Raw Material Inflation: Tinna imports 70% of ELTs. Freight, forex volatility, and geopolitical tension could squeeze margins.
Product Ramp Timing: Both polymer compounding and abrasives are early-stage. Delay in customer acquisition or offtake volumes could push breakeven.
Valuation Compression: If FY26 PAT or revenue growth slows (below 25%), P/E could compress back to 20× or lower.
Working Capital Reversal: While WC cycle improved to 42 days, higher inventory from new verticals or international shipments could push it back up.
📌 Watchlist: Carbon black commissioning, Saudi/South Africa ramp, Varale utilization, and freight normalization will be key FY26 triggers.
8. Implications for Investors
8.1 Bull, Base & Bear Scenarios — Tinna Rubber

Tinna’s track record of execution, stable cash flows, and margin discipline provides confidence in the base case. Optionality in Saudi, South Africa, and carbon black remains underappreciated — offering asymmetric upside if FY27–28 projects deliver ahead of plan.
8.2 Is There Any Margin of Safety?
✅ Where There Is Margin of Safety
Business Model Strength
Product diversity: CRMB, bitumen emulsion, polymer compounding, steel abrasives.
Execution history: 30%+ 3-year revenue CAGR; ROCE >26%.
Capital Structure
Capex largely done; ₹50 Cr invested in FY25, future ₹100 Cr capex well flagged.
Net debt stable with ample room for QIP if needed.
Upsides Not Priced In
Carbon black vertical (₹100 Cr capex) not modeled in FY26.
Saudi & South Africa JVs to contribute from FY26–27 but not factored into valuation.
PC & MB and steel abrasives still <5% of revenue, with significant scale-up room.
Valuation vs Earnings
At CMP (₹925), FY28 P/E = 14.9× and EV/EBITDA = 16.3× — attractive for a company guiding 33% PAT CAGR.
❌ Where There Isn’t Much Margin of Safety
Valuation is Full (Short Term)
FY25 P/E = 32.8×, EV/EBITDA = 38.6× — high expectations built into current price.
Leaves limited room for error in FY26 revenue or margin delivery.
Execution & Ramp-Up Risk
Delay in carbon black or Saudi project execution could shift upside to FY27.
Varale and PC/MB margin delivery must improve to hit 18% margin target by FY28.
While short-term multiples appear rich, FY28 PEG ratio ~0.45× suggests long-term upside.
Any beat on product ramp, carbon black execution, or Saudi volumes could make current price look conservative in hindsight.
Previous coverage of TINNARUBR

Don’t like what you are reading? Will do better. Let us know at hi@moneymuscle.in
Don’t miss reading our Disclaimer