
TD Power Systems FY25 Review: PAT Up 50%, FY26 Set for 25%+ Revenue Growth
Outlook of strong growth till FY27 supported by increasing capacities. Export growth, ramp-up in electric motors & rail orders, & margin strength key to sustaining valuations
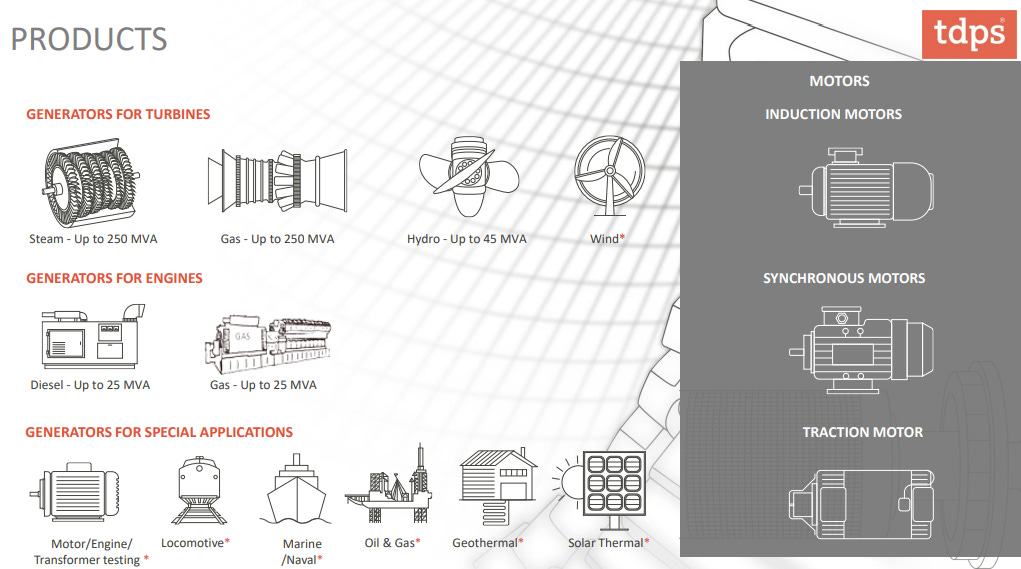
1. Motors & Generators Manufacturer
tdps.co.in | NSE: TDPOWERSYS
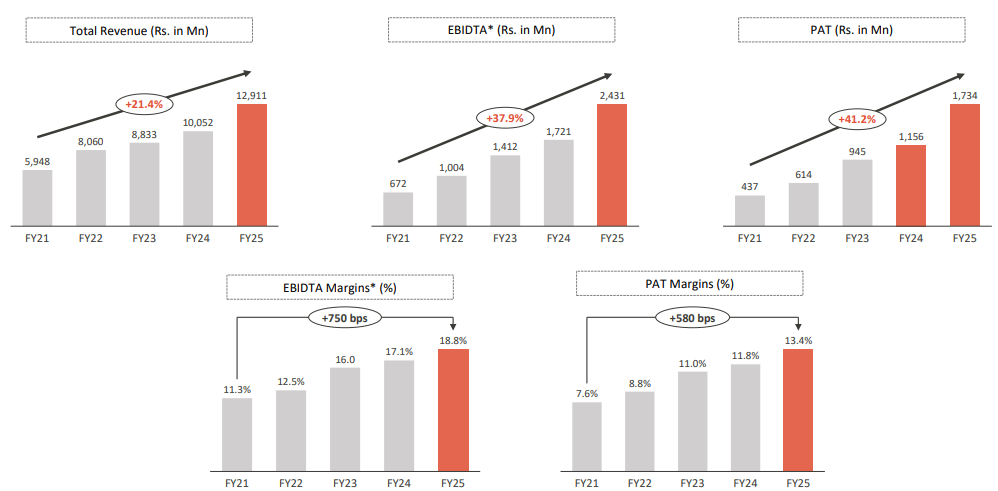
2. FY21-25: PAT CAGR 41% | Revenue CAGR 21%
2.1 What changed between FY21-25?
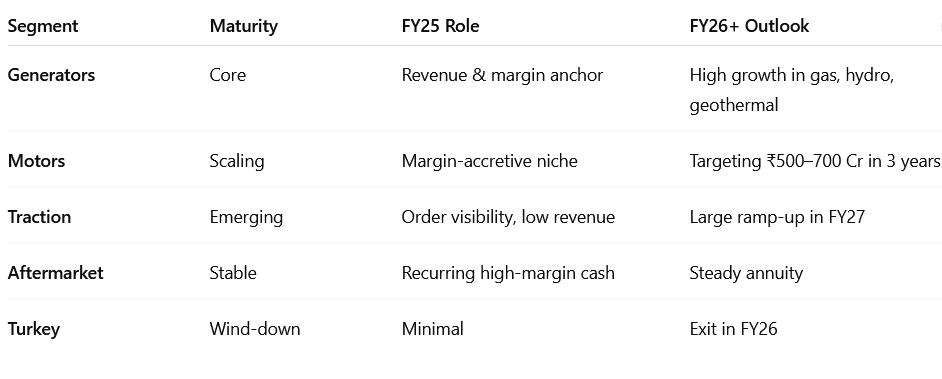
Scale of Operations Doubled: Global market expansion, product diversification (motors, hydro, geothermal), and revival in domestic demand.
Margin Expansion: Increased export share, better product mix, leaner operations, and selective participation in higher-margin projects (e.g., data centers, geothermal, traction motors)
Exports Became the Growth Engine: Focus on clean energy, grid stabilization, and AI-linked infrastructure in export markets transformed the business
Product Portfolio Expansion: From Steam turbine generators to Gas & geothermal generators, Motors (synchronous, induction), Traction motors (NPCIL, export markets), Grid stabilization & data centers
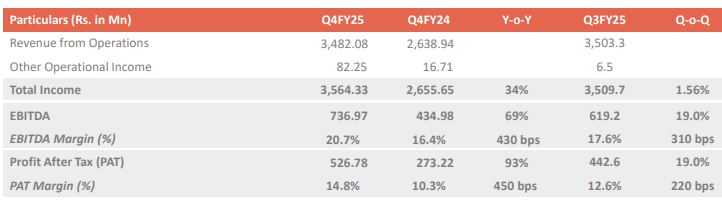
3. Q4-25: PAT up 93% and Revenue up 34% YoY
PAT up 13% and Revenue up 2% QoQ
Strong Export Momentum: Reduced dependency on Indian capex cycles
Product & Segment Mix Expansion: New wins showcase TDPS’s entry into high-value, high-spec segments:
Margin Expansion = Operating leverage + forex tailwinds + favorable product mix
Revenue was flat QoQ, indicating capacity utilization nearing peak.
New plant (3rd unit) expected to go live in H2-26, unlocking growth from FY26 onward
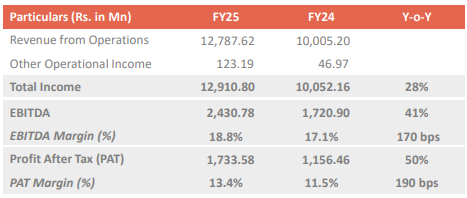
4. FY-25: PAT up 50% and Revenue up 28% YoY
Growth broad-based across all four quarters, with revenue rising QoQ despite Q3 softness in the domestic market
Indicates an underlying structural demand rather than cyclical spurts.
Motors & Traction Businesses Evolved from Incubation to Delivery
New verticals are scalable, margin-accretive, and lay the foundation for ₹500–1,000 Cr incremental revenue over 3–4 years.
4.1 Segmental Performance — FY25
5. Business Metrics: Strong & improving return ratios
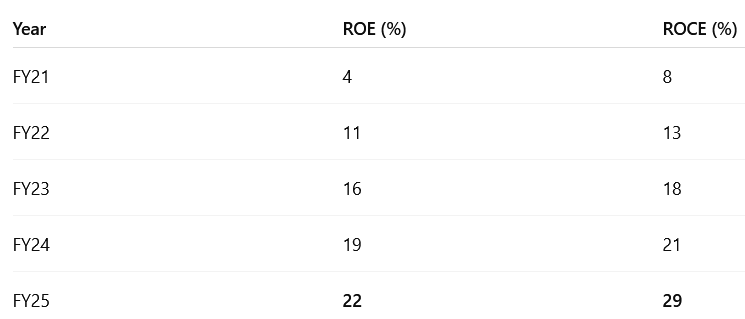
ROCE > ROE = Capital-Light Model
TDPS is self-funded and not reliant on leverage to generate returns.
TDPS now operates in a high-ROCE, high-ROE zone, offering attractive capital efficiency.
Sustaining >20% ROE and >25% ROCE makes it a compounding business, especially with:
Third plant coming online
Motors/traction/gas turbine scaling
Minimal debt, high cash reserves
6. Outlook: 25% growth in FY26
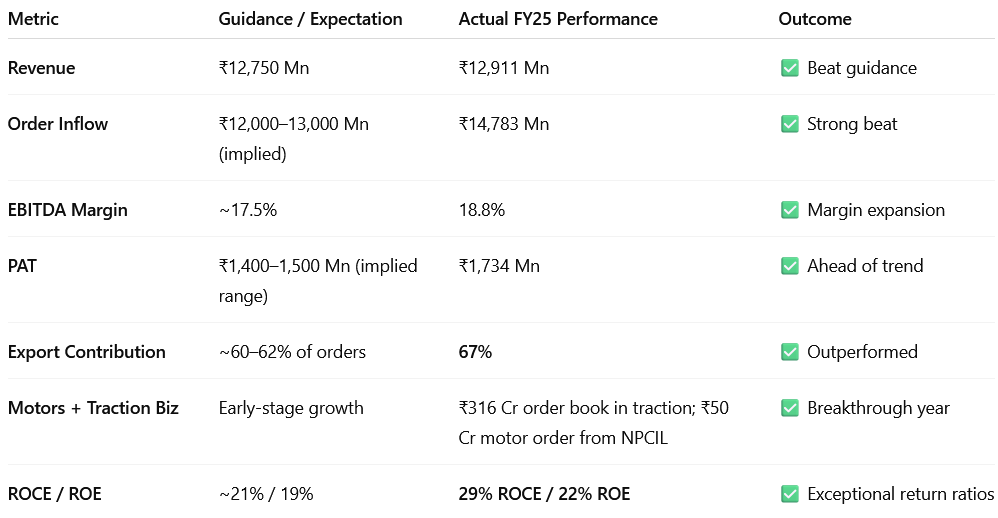
6.1 TD Power Systems – FY25: Expectations vs. Performance
Hits (What Went Right)
Record-high order inflow — driven by strong export momentum
Revenue of ₹12,911 Mn, slightly above guidance despite capacity saturation.
EBITDA margin improved — aided by product mix and automation.
ROE and ROCE — among best-in-class capital efficiency in the sector.
Breakthrough in motors and traction — new verticals gaining revenue visibility.
Export growth led by wins in U.S. AI data centers, geothermal in Turkey, hydro in Nepal, and traction in Germany/U.S./CIS.
Maintained a healthy cash reserve, enabling self-funded expansion and working capital buffer.
Strong FX management with forward booking led to material forex gains in Q4.
Misses / Constraints (What Fell Short or Needs Attention)
Capacity constraints limited further revenue growth; Q4 was flat QoQ. New plant to unlock growth only from H2 FY26.
Domestic order inflow weak at just 4% YoY growth — India remains dependent on steam turbine demand.
Receivables rose to ₹437 Cr; ~20% above 90 days due to March-end invoicing and back-loaded collection cycle.
High inventory buildup (copper/steel) impacted FY25 operating cash flow, though strategic in nature.
Planned exit from Turkey post FY25 due to regulatory overreach; minor impact on P&L.
Delay in Phase 2 geothermal deal (~1,000 MW U.S. project) — not closed in FY25; expected decision in FY26.
6.2 TD Power Systems – Guidance & Outlook for FY26 and Beyond
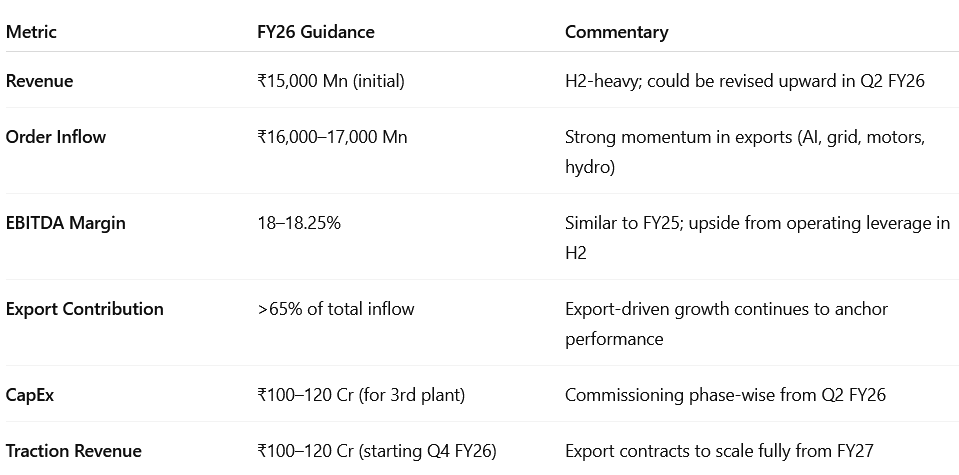
Strategic Outlook: FY26 and Beyond — Key Growth Drivers
Third manufacturing plant comes online in Q2 FY26, unlocking capacity to scale to ₹1,800–2,300 Cr revenue over the next 2–3 years.
Motors and traction businesses move from pilot to mainstream:
Traction motor contracts from Germany, U.S., CIS to contribute in FY26 and scale sharply in FY27–28.
Motor business targeting ₹500–700 Cr in 3 years via oil & gas, nuclear, and process segments.
Export tailwinds remain strong:
AI data centers (U.S.)
Grid stabilization (Europe)
Geothermal (Turkey, U.S.)
High-voltage and custom applications across emerging markets.
New design center in the UK enables TDPS to move into large machine R&D (up to 100 MW) — positioning it for deeper entry into high-value segments.
FY27–FY28 Trajectory
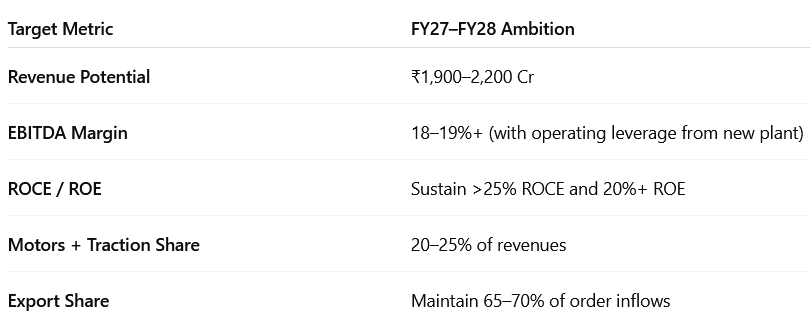
FY26 is a capacity-linked transition year, with Q3/Q4 inflection expected.
FY27–FY28 will reflect full capacity utilization, deeper export relationships, and a broader product portfolio.
7. Valuation Analysis
7.1 Valuation Snapshot
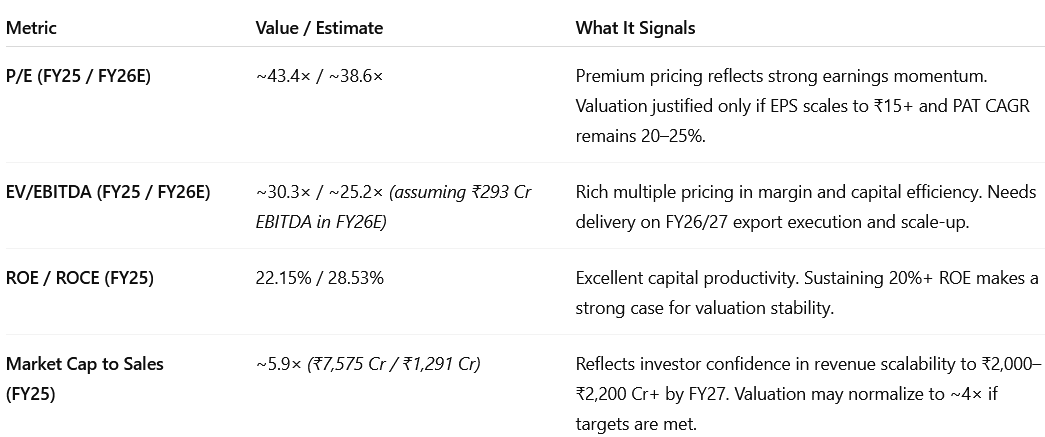
7.2 What’s in the Price?
This reflects a valuation that already bakes in several strengths, including:
Strong FY25 execution: 28.5% ROCE, 22% ROE, and record PAT.
Premium business model: Zero-debt, export-led, and margin-accretive.
18%+ EBITDA margin profile, with long-term stability.
Diversification into motors and traction, with initial orders booked.
High visibility on FY26 topline (~₹1,500 Cr) and export pipeline strength.
Global relevance: 67% of order inflows from export markets like U.S., Europe, Turkey, CIS.
Capital discipline and ~₹200 Cr cash buffer for self-funded expansion.
The market is valuing TDPS as a quality compounder with sustained margin leadership and capital efficiency — pricing in near-term earnings growth and execution stability.
7.3 What’s Not in the Price? (Potential Upside Triggers)
A. FY27–FY28 Revenue Scale-Up
Outlook on ₹1,900–₹2,200 Cr revenue in FY27, with visibility from exports, traction, and motors.
This implies 25%+ revenue CAGR, not yet factored into P/E compression or PEG multiples.
B. Operating Leverage from New Capacity
Phase-wise commissioning of the 3rd plant in H2 FY26 will unlock topline growth without equivalent fixed cost buildup.
EBITDA can scale faster than revenue — a margin expansion lever underappreciated by the market.
C. Motors & Traction – Multi-Year Compounding
FY25 saw the first ₹50 Cr motor order and ₹316 Cr traction order book.
Motors + traction could contribute ₹400–500 Cr+ revenue by FY28 — not meaningfully in current consensus models or street forecasts.
D. Large Export Wins Not Yet Priced
Geothermal Phase 2 (U.S.), data center projects, and European grid orders are in advanced stages.
Award of any gigawatt-scale projects could lift revenue/earnings guidance materially.
E. Strategic Optionality from Design Center
The UK-based R&D hub will enable TDPS to enter large machine segments (40–100 MW) — potential to tap OEM partnerships and new verticals (nuclear, utility-scale).
8. Implications for Investors: What to Watch
8.1 Bull, Base & Bear Case Scenarios – TD Power Systems
Bull Case
Outperformance across all verticals leads to strong earnings compounding and valuation re-rating.
Revenue Growth: ₹2,200 Cr+ by FY27, driven by exports, traction motors, and new large generator segments
EBITDA Margin: 19–20%+, aided by operating leverage from new capacity and high-value exports
Motors & Traction: Contribute ₹500–600 Cr revenue by FY28 with healthy margins
Capital Allocation: Consistent internal accruals fund expansion; optionality to raise dividends or pursue value-accretive R&D/JV initiatives
Valuation: P/E sustains at 40–45×, supported by 20%+ ROE/ROCE and global growth narrative
Base Case
Execution matches guidance with moderate upside; margin profile and capital efficiency remain intact.
Revenue Growth: ₹1,900–2,000 Cr by FY27, in line with management guidance
EBITDA Margin: 18–18.5%, stable with slight H2 improvement post plant ramp-up
Motors & Traction: Grow to ₹350–400 Cr by FY28; still early-stage scaling
Capital Allocation: Controlled capex and consistent working capital management; conservative use of cash
Valuation: P/E settles around 35×, consistent with high-ROCE industrials
Bear Case
Delays in execution or margin pressure from scale-up weigh on earnings and multiples compress.
Revenue Growth: <₹1,700 Cr by FY27 due to capacity delays, export project push-outs, or weak domestic orders
EBITDA Margin: 16–17% due to underutilized capacity and fixed-cost drag in H1/H2
Motors & Traction: Ramp-up slower than expected; contribute <₹250 Cr by FY28
Capital Allocation: Working capital remains elevated; cash reserves decline with minimal return accretion
Valuation: P/E contracts to 28–30× due to weaker earnings momentum
8.3 Key Risks & What to Monitor
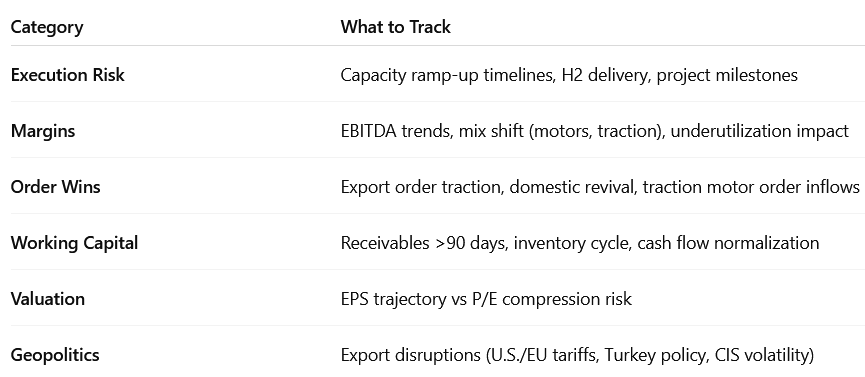
A. Execution Risk – Capacity & Deliveries
FY26 is a make-or-break execution year as new capacity becomes operational in Q2. Slippage in commissioning or underutilization in H2 could delay revenue realization and dent margin forecasts.
Monitor: Plant commissioning updates, Q3/Q4 run rate, export shipment timing, capacity utilization metrics.
B. Margin Pressure from Mix Shift
New verticals like motors and traction have lower margins initially. If they scale faster than high-margin generator exports, blended EBITDA margin may compress below 18%.
Monitor: Segment-wise margin disclosures, fixed-cost absorption from new plant, scaling timeline for motors/traction.
C. Order Book & Export Visibility
Execution is contingent on timely order conversion, especially from the U.S. (AI/data centers, geothermal) and Europe (grid stabilization). Weak order intake or delays in FY26 could derail FY27 guidance.
Monitor: Quarterly order inflow disclosures, export vs domestic mix, project geography breakdown, renewal trends in core markets.
D. Working Capital & Cash Flow Risk
FY25 saw elevated inventory and receivables due to steel/copper stocking and March billing. If cash conversion doesn’t normalize by Q2 FY26, ROCE may soften despite PAT growth.
Monitor: Receivable days, inventory turnover, quarterly operating cash flow, capex cadence.
E. Valuation Sensitivity
At ~43× trailing P/E, the stock requires FY27 PAT delivery to defend premium multiples. Any deviation from the ₹15–₹17 EPS path may trigger valuation compression.
Monitor: EPS upgrades/downgrades, margin trend, forward P/E bands vs peer industrials.
F. Geopolitical / Trade Risk
TDPS’s growth engine is export-led (~67% of orders). Shocks such as U.S. tariffs, European over-regulation, or instability in Turkey/CIS could disrupt key contracts.
Monitor: U.S. trade policy updates, EU clean energy procurement trends, geopolitical advisories in Turkey, Ukraine, Middle East.
9. Margin of Safety for a TD Power Systems Investor
A. Valuation Already Prices in Strong Execution with Limited Downside Buffer
At ~43× trailing and ~39× forward P/E, TD Power Systems is priced as a high-growth compounder, assuming:
Sustained PAT CAGR of 20–25% over FY25–FY28
EBITDA margins remain in the 18–19%+ range
Export revenue scales from ₹850 Cr+ to ₹1,500 Cr+ by FY27
Motors and traction commercialize smoothly and profitably
➡️ These embedded expectations leave little margin for execution error.
Any delay in capacity ramp-up, export project deferral, or margin compression could trigger a derating toward 30–35× P/E.
B. New Business Lines Still Scaling
Traction motors are in the prototype-to-production phase and yet to contribute to FY26 revenue meaningfully.
Motors business, while promising, must demonstrate repeatability, operating leverage, and competitive positioning.
Design-led differentiation from the UK R&D center will take time to reflect in financials.
These verticals are optionality, not certainty — execution delays can impact FY27–28 earnings assumptions.
C. What’s Protecting the Downside?
Despite a rich valuation, TDPS benefits from structural strengths that anchor downside risk:
Zero-debt, asset-light model with ₹200 Cr+ in cash
High ROE (22%) and ROCE (29%) with low reinvestment intensity
Strong export diversification (67% of FY25 order inflow), reducing domestic cyclicality
Long-cycle orders in AI, grid, geothermal, and traction ensure multi-quarter revenue visibility
High-quality earnings with no aggressive accounting or capital dilution
These factors don’t prevent short-term drawdowns, but do protect long-term capital erosion.
9.1 Overall Margin of Safety: Low to Moderate
TD Power Systems is a “quality at a premium” bet — most suited for investors with a 2–3 year horizon who believe in:
Global clean-tech & power infra growth
Indian export manufacturing upcycle
Management’s ability to convert capacity into margin-accretive execution
In the short term, the valuation offers limited buffer. But for long-term investors, the business quality and capital discipline create a compelling runway.
Don’t like what you are reading? Will do better.` Let us know at hi@moneymuscle.in
Don’t miss reading our Disclaimer