
Shilchar Technologies Q2 FY26 Results: PAT Up 40%, On-track FY26 Guidance
2x Revenue in FY26-29 at ~25% CAGR. Growth back-loaded due to capacity. Tariffs, competitive pressure, with reasonable valuations weigh in, but demand is strong
1. Power & Distribution Transformer Manufacturer
shilchar.com | BOM: 531201

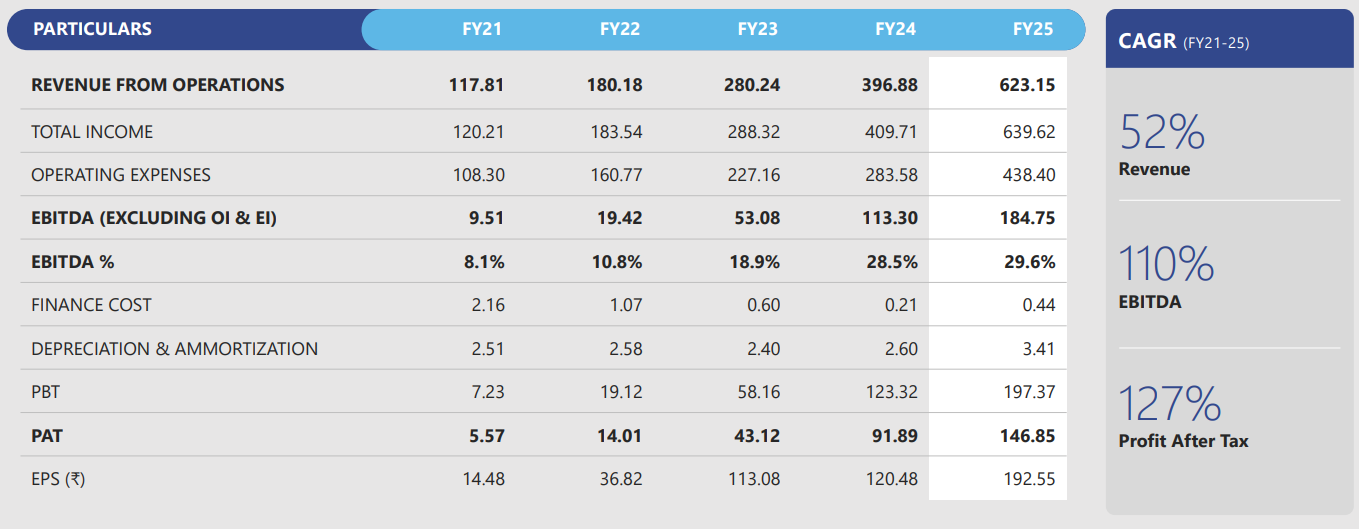
2. FY21-25: PAT CAGR of 127% & Revenue CAGR of 52%
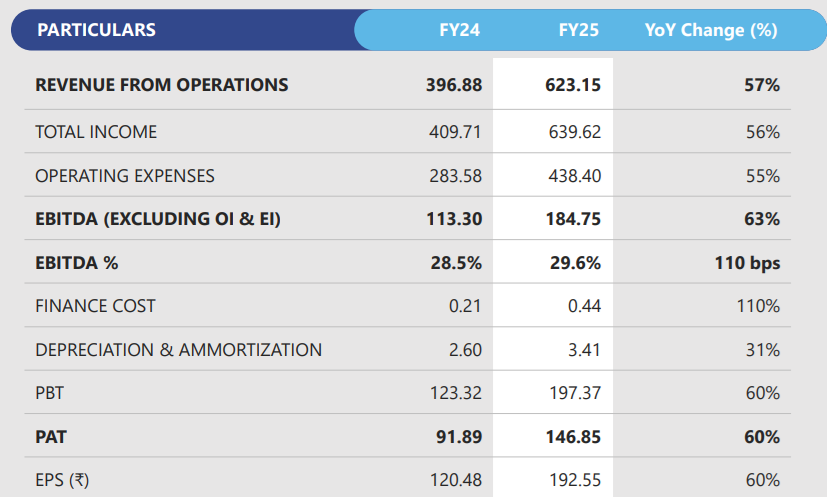
3. FY25: PAT up 60% & Revenue up 57% YoY
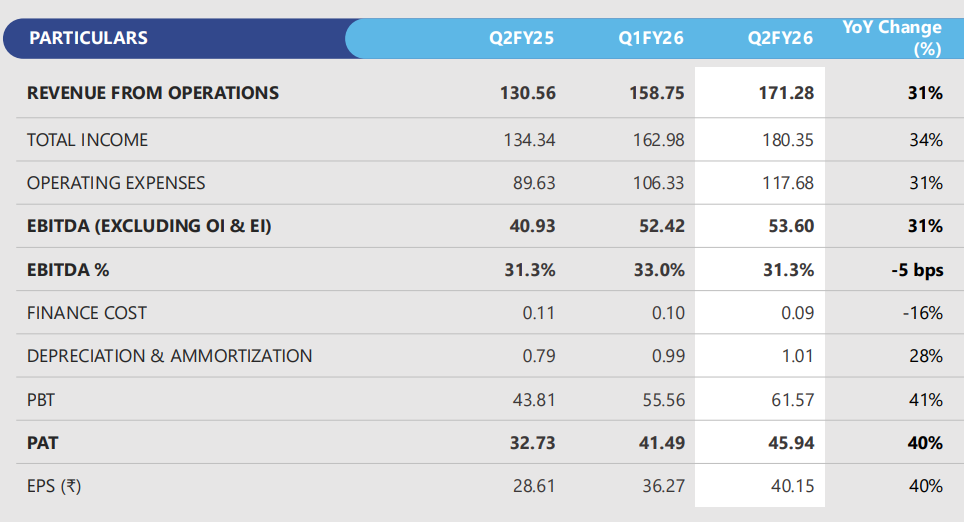
4. Q2-26: PAT up 40% & Revenue up 31% YoY
Revenue growth — Demand from solar and renewable customers remained robust
Profitability steady despite inflation and tariffs — cost discipline and pricing power
Capacity utilisation at 90–95% — Order execution remained on schedule; no cancellations or delivery deferrals were reported.
Exports remained resilient despite new U.S. tariff measures (50%) effective August 2025 — customers continued sourcing from Shilchar due to quality and reliability.
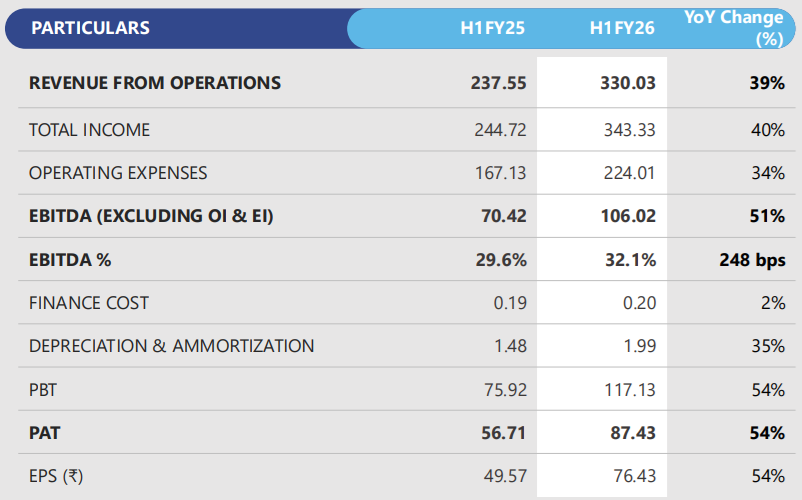
5. H1-26: PAT up 54% & Revenue up 39% YoY
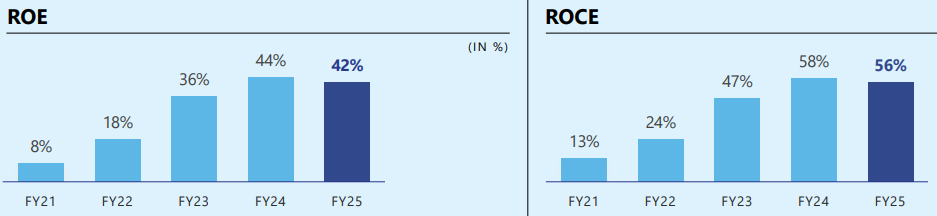
6. Business metrics: Strong & improving return ratios
7. Outlook: FY26-29 CAGR of 25%
7.1 Management Guidance and Future Outlook
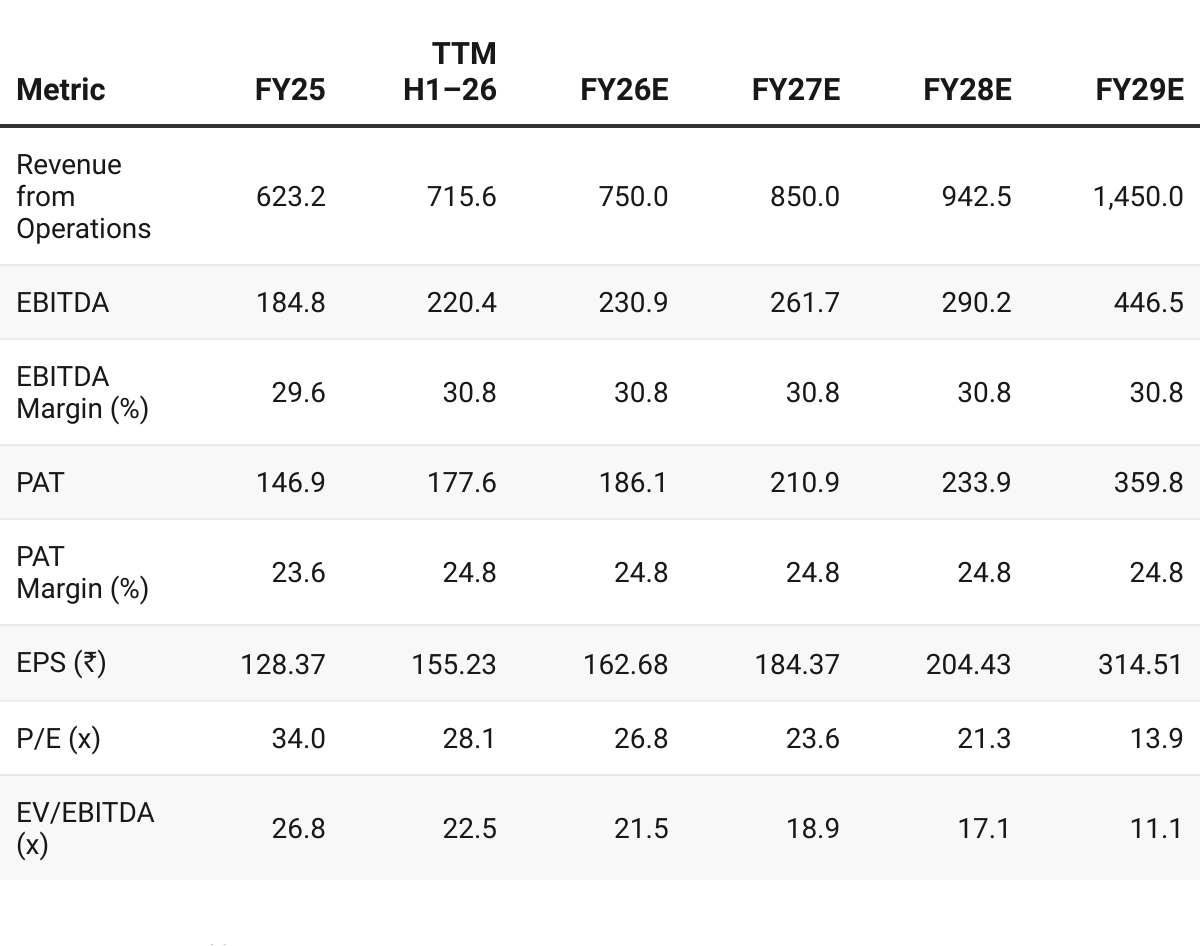
Revenue CAGR FY26-29= 25% — ₹750 Cr to ₹1,400-1,500 Cr
FY26
Target of ₹750 Cr revenue
Downward revision from the ₹750-800 Cr target given in Q1-26 call
Order Book: On hand orders of ~₹300 Cr — to be executed in FY26
Capacity Utilization: Expected to be about 90-95%
Margins: Management expects to maintain EBITDA margins around 31–33% and PAT margins near 25%, despite tariff-related uncertainty in the U.S. market.
Capacity Expansion & Capex Plan
Capacity addition: +6,500 MVA, taking total to 14,000 MVA by April 2027
Capex: ₹90 crore, fully funded via internal accruals (debt-free balance sheet)
At full utilization, management estimates ₹1,400–1,500 Cr annual turnover.
FY27
Target revenue of ₹850 crores — a growth of about 10-20%
Growth, despite high utilization, will be driven by aggressive efforts to utilize capacity more fully in Q1 and Q2, which are typically slower periods in the domestic market.
FY28
For the first year the new capacity goes live — targets achieving 60-70% capacity utilization.
Revenue = 60-70% of the ₹1,400–1,500 Cr capacity ~65%*1450
FY29
First year of full realization of the ₹1,400–1,500 Cr capacity
Growth Drivers & Strategic Initiatives
Strong domestic demand:
The domestic power and renewable sector continues to provide tailwinds
The long-term (5-6 year) bullish cycle is driven by the government’s push for 100% electrification in India and significant focus on renewable energy.
Industry Overcapacity: Despite widespread announcements of CAPEX in the transformer industry, management does not see overcapacity issues happening for at least the next 3 to 4 years.
Export markets:
U.S. market faces new tariff measures (50%) since Aug 2025. However, Shilchar’s customers are absorbing these duties due to limited alternatives, keeping demand stable.
Export mix (H1 FY26): ~50% of revenue; U.S. contributes 12–15%, rest from Middle East, Africa, Europe, and Far East.
Diversification into higher class transformers:
Capacity expansion will enable manufacturing of up to 100 MVA, 220 kV class transformers—a higher voltage range that expands addressable market size and improves realizations.
7.2 H1 FY26 vs FY26 Guidance
Revenue On Target, Slightly Ahead on Profitability
Revenue trajectory: H1 revenue at ₹330 Cr (44% of guidance) suggests clear visibility to ₹750 Cr FY26 target — H2 is typically strong than H1.
The company recalibrated tone from aggressive (₹800 Cr) to pragmatic (₹750 Cr) amid capacity constraints and tariff volatility.
Profitability: Both EBITDA (32.1%) and PAT (26.5%) at the upper end of guided margins, underscoring strong operational control.
Export risks: U.S. tariff changes acknowledged but no order cancellations or pushbacks, validating resilience.
8. Valuation Analysis – Shilchar Technologies
8.1 Valuation Snapshot
CMP ₹4360.00; Mcap ₹4987.93Cr
Shilchar trades at a discount to top peers despite better profitability and debt-free status.
TTM (H1-26) 28.5 P/E (x), 22.5 EV/EBITDA (x) — Fair, fully pricing near-term growth
FY26E — Inline with mid-cap industrial average
FY27E 24.0 P/E (x), 18.9 EV/EBITDA (x) — Slight re-rating possible
FY28E, FY29E — Appears reasonable on long-term visibility
At P/E ≈ 28× TTM, Shilchar trades near fair value on current earnings but offers multi-year compounding visibility as capacity doubles by FY28.
8.2 Opportunity at Current Valuation
New capacity coming online in FY28 is not fully discounted at current valuations
Until the new capacity becomes operational in FY27, Shilchar may go through phases of subdued market interest. Such consolidation phases can offer attractive entry points, setting up investors for the next re-rating cycle through FY27–FY29.
Tailwind Support: Strong demand from renewable energy (solar, wind), global transformer shortages, and grid capex ensures order inflow remains robust until new capacity arrives.
8.3 Risk at Current Valuation
Growth is back-loaded into FY29
Valuation Risk: The stock already discounts growth and margins till FY27.
Capacity Bottleneck: Growth is constrained till FY28 when new capacity comes online
Execution Risk: If new capacity is delayed then growth gets delayed into FY30 which is too long to take a call on.
Over-capacity cycle risk (FY28–FY29): Indian transformer players are expanding simultaneously. If demand moderates after FY27, pricing discipline may erode and compress margins
Competitive Intensity: Multiple peers have announced aggressive expansions; rising industry capacity could pressure pricing and dilute Shilchar’s current margin advantage.
Policy Uncertainty: Export-driven growth faces risks from US tariff policy and other trade restrictions, which may impact order flow or realizations.
Previous coverage of Shilchar

Don’t like what you are reading? Will do better. Let us know at hi@moneymuscle.in
Don’t miss reading our Disclaimer