
SG Finserve FY25 Results: Flat PAT, Guides for 80-90% PAT CAGR FY25-27
SG Finserve targets AUM ₹6,000 Cr revenue by FY27 with ROA expanding to 4.5-5% and ROE to 18-20%. Stock fully prices perfect execution, leaving no room for error.
1. NBFC — Supply Chain Financing
sgfinserve.com | BSE: 539199

2. FY23-25: PAT CAGR 112% & Total Income CAGR 113%

2.1 What Changed Between FY23 and FY25
SG Finserve matured from a startup lender to a scaled, tech-first NBFC delivering consistent growth, profitability, and risk control.
Scale-Up in Operations: Disbursements ~3x — AUM ~2x
Revenue & Profit Surge: Net interest income rose 3×, supported by repeat borrowers
Balance Sheet Strengthened
Equity base expanded, fully funded future growth with debt-equity of 3:1
Flawless Asset Quality: 0% GNPA from FY23 through FY25
Business Model Evolution
Shift from anchor-only to full supply chain financing (anchor → distributor → retailer)
Increased anchor count to 44+, including Tata, Adani, JSW, Vedanta
Regulatory Pause & Recovery
FY25 H1 pause for NBFC licensing compliance
Strong rebound in H2 with ₹758 Cr AUM added in Q4 alone
3. Q4-25: PAT Flat & Total Income down 3% YoY
PAT Flat & Total Income up 33% QoQ
Following the H1 regulatory reset and H2 growth rebound — SG Finserve’s operating engine returned to full strength. The company exited FY25 with record disbursements, a scaled loan book, and stable profitability, setting the tone for FY26.

Loan Book Surge: AUM jumped 48% QoQ — reflecting onboarding of new borrowers and higher anchor utilization, especially in March.
Income Recovery: Total income rebounded 33% QoQ, reversing the Q3 dip caused by temporary funding cost transitions.
Steady Earnings: PAT held steady at ₹23.8 Cr — suggesting profitability normalization even as volumes scaled and leverage increased.
Disbursement Acceleration: up 9% QoQ and 14% YoY — shows strong demand from MSMEs and confident anchor participation.
4. FY-25: PAT up 3% & Total Income up 1%
FY25 was a tale of two halves for SG Finserve. After a regulatory-driven pause in H1 to comply with Type II NBFC licensing norms, the company bounced back strongly in H2, scaling disbursements, expanding its loan book, and maintaining zero NPAs. Despite the temporary slowdown, SG Finserve closed the year with stable profitability and a strengthened foundation for future growth.

Loan Book Growth: Added ₹650+ Cr in H2; FY25 ended with record AUM.
Profit Held Steady: PAT at ₹81 Cr; Q4 run-rate normalized at ₹24 Cr.
Income Dip Absorbed: 10% drop due to H1 pause; H2 saw sharp rebound.
5. Business Metrics: Muted Return Ratios

SG Finserve’s return ratios reflect the maturing of its lending platform. While FY23 and FY24 saw strong profitability expansion, FY25 marked a phase of balance sheet strengthening and capital infusion. Despite a lower ROE in FY25, the structural indicators remain healthy
6. Outlook: 83-92% PAT CAGR for FY25-27
6.1 FY-25 Expectations vs Performance — SG Finserve

✅ Hits: Where SG Finserve Delivered
AUM Target Achieved: FY25 with ₹2,326 Cr in loan book — within the guided ₹2,300–2,500 Cr range.
PAT Stability: Flat PAT despite cost pressures, in line with H2 run-rate targets.
Zero NPAs: third year in a row.
Anchor Ecosystem Expanded: Crossed 44 anchor programs, up from ~35 in FY24, including large corporates (Tata, Adani, Vedanta).
Tech Execution: AI-based borrower scoring, GST-linked monitoring, and app infrastructure all launched/prepared.
❌ Misses: Where Expectations Fell Short
Income Growth Lagged: Total income fell 10% YoY vs expectation of strong H2 offset — due to weak fee income and delayed scale-up.
ROE Below Guidance: ROE at 8.8% vs 18–20% guidance, as equity base expanded faster than PAT.
Retail Lending Rollout Delayed: Planned Q4FY25 launch was deferred to FY26, despite signed distribution MOUs.
NII Compression in Q4: Margins compressed as funding mix shifted toward bank borrowings in Q4.
Overall, FY25 execution was strong in risk, lending operations, and tech buildout — though profitability scaling and new verticals slipped behind schedule.
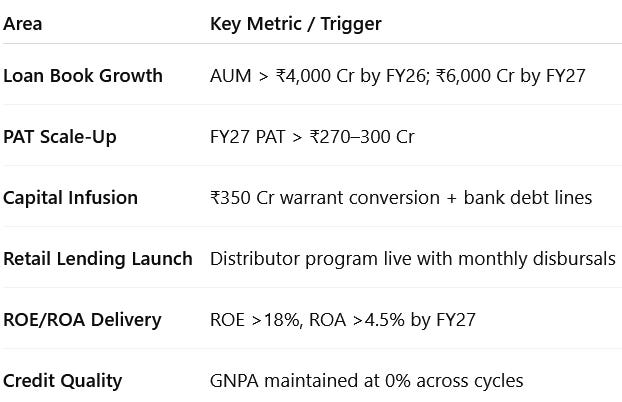
6.2 Management Guidance and Future Outlook
PAT CAGR of 83-92% as FY24 PAT grows from ₹81 Cr to ₹270-300 Cr by FY27 based on ₹6,000 Cr of AUM with ROE of 18-20% & ROA of 4.5-5%
We are confident that we can take this loan book from INR2,300 crores to INR4,000 crores in 12 months and INR6,000 crores by FY27 and while growing this loan book, we are being very prudent that we continue to achieve ROE of 18% to 20% with ROA of 4.5% to 5%
The company’s stated growth roadmap is primarily focused on:
Anchor deepening
Retail/distributor lending rollout
Technology upgrades (AI tools, ERP integration, mobile app)
Capital infusion via warrants (₹350 Cr pending)
Expanding bank lines and leverage up to 3:1
Strategic Vision
Continue as a specialist in supply chain finance, with deep penetration across large anchors.
Future expansion into Tier-2 retail financing—from anchor ➝ distributor ➝ retailer—to deepen value-chain monetization without raising risk.
Leverage proprietary technology stack: digital onboarding, 24/7 disbursements, anchor ERP integrations, digital documentation.
7. Valuation Analysis — SG Finserve
7.1 Valuation Snapshot

At the current market cap of ~₹2,400 Cr, the stock trades at:
8.0× – 8.9× FY27E earnings, and
1.61× FY27E book value
This reflects a significant valuation compression if SG Finserve delivers on its growth and return guidance — suggesting the stock is currently pricing in only part of the forward potential.
Based on FY27E fundamentals, SG Finserve trades at deep forward valuation multiples, offering scope for re-rating if execution remains on track.
7.2 What’s in the Price?
The current market cap of ₹2,408 Cr appears to price in core growth delivery over the next 2–3 years:
FY27 PAT of ₹270–300 Cr implied through management’s AUM and return guidance.
Implied PAT CAGR of ~60% from FY25–27, with forward P/E of ~9× on FY27 earnings.
ROE of 18–20% and ROA of 4.5–5% by FY27 are assumed to be achieved without NPA shocks.
₹6,000 Cr AUM by FY27 fully priced in, based on growth from anchor deepening and distributor rollouts.
Valuation assumes flawless execution with zero asset quality slippage and timely equity infusion (~₹350 Cr pending via warrants).
📌 The stock reflects a clean growth trajectory — with no room for capital or credit surprises.
7.3 What’s Not in the Price?
Several growth levers remain underappreciated or not factored into current valuation:
Retail & Tier-2 Distributor Lending Launch (FY26): High-volume, higher-yield segment not yet monetized.
QIP-Funded M&A or NBFC consolidation plays could provide inorganic upside not priced in.
Fee income expansion via digital platform monetization (e.g., collections, scoring, analytics) remains untapped.
Strategic partnerships with OEMs or anchor-driven embedded finance could expand use cases.
Valuation re-rating to 18–20× P/E is possible if PAT sustainably crosses ₹300 Cr and ROE exceeds 20%.
🚀 Current P/E of ~9× FY27 earnings leaves room for multiple re-rating if scalability surprises on the upside.
7.4 Risks and What to Monitor
Execution risk is front-loaded. Given low forward P/E and high internal targets, even small delays or slippages could trigger de-rating.
Key Risks
Execution Risk: Delay in distributor/retail rollout or anchor program saturation could slow disbursement velocity.
Funding Risk: ₹350 Cr in committed capital (via warrants) must arrive on time to support AUM growth.
ROE Dilution Risk: Equity infusion ahead of earnings ramp-up could delay hitting 18–20% ROE target.
NIM Compression: Funding mix shift toward bank debt must be managed to avoid margin erosion.
Regulatory or Classification Risk: Shift in NBFC norms or risk-weight changes could affect capital ratios.
What to Monitor
SG Finserve has the ingredients for strong compounding — but it must now scale without missteps, as the current valuation bakes in high execution certainty.
8. Implications for Investors
8.1 Bull, Base & Bear Scenarios — SG Finserve
Bull Case ( Probability = Moderate)
Loan book scales faster to ₹6,500–₹7,000 Cr by FY27 driven by strong distributor/retail ramp-up.
PAT exceeds ₹325 Cr.
ROE expands to 22%+.
P/E re-rates to 18–20×, P/B to 5.5–6×.
Strategic anchor tie-ups and higher fee monetization drive upside.
Base Case (High)
AUM of ₹6,000 Cr by FY27, PAT of ₹270–300 Cr. ROE at 18–20%.
Execution steady; retail rollout begins FY26.
P/E stabilizes at 12–14×, P/B at 4–4.5× on consistent delivery and zero NPA track record.
Bear Case (Moderate)
Delays in retail lending or anchor saturation limits AUM to ₹5,000 Cr.
PAT capped at ₹200–220 Cr.
ROE below 15%.
Market rerates downward to 8–9× P/E, 2.5–3× P/B due to growth slowdown and funding dilution overhang.
8.2 Is There Any Margin of Safety?
🔍 Where There Is Margin of Safety
1. Business Model Strength
Anchor-backed supply chain financing model with zero GNPA track record
Short-tenure, high-velocity lending ensures rapid capital turnover
Tech-led operations reduce opex and improve risk control at scale
2. Capital Structure & Liquidity
₹1,000+ Cr equity base with low leverage; ₹350 Cr capital infusion already committed
ROE expected to rise from 9% to 18–20% as operating leverage kicks in
Clean balance sheet offers downside protection against funding shocks
3. Execution Optionality Not Priced In
Retail/distributor lending (FY26 rollout) could materially expand addressable market
Fee income monetization (ERP integrations, real-time payments) yet to be unlocked
FY27 PAT of ₹300 Cr implies current market cap (~₹2,408 Cr) is just 8–9× forward earnings
Valuation compresses to ~8× FY27 earnings if guidance plays out — implying you're buying into forward growth at a discount, not a premium.
❌ Where There Isn’t Margin of Safety
1. Valuation Already Reflects Execution Confidence
At 32× FY25 P/E and 2.4× P/B, the stock assumes 25–30% PAT CAGR over 3 years
The current price bakes in ₹6,000 Cr AUM, 0% NPA, and 20% ROE — with no cushion for underperformance
2. Execution & Regulatory Risks
Delay in distributor rollout or anchor saturation could slow AUM growth
Capital infusion delays or weaker credit underwriting in retail could drag ROE below 15%
Any rise in credit costs or margin compression could lower PAT and trigger de-rating
3. No Room for Misses
A ₹50–70 Cr PAT miss in FY26 or slower ramp-up in FY27 could keep P/E above 25×
If growth lags, current valuations will not hold — leaving little valuation buffer
🎯 Bottom Line: The margin of safety lies in the business model and risk controls, not the stock price. You're paying for execution — but if delivered, you're locking into FY27 earnings at <9× P/E. That asymmetry is where the opportunity lies.
Don’t like what you are reading? Will do better. Let us know at hi@moneymuscle.in
Don’t miss reading our Disclaimer