
Oswal Pumps Q1 FY26 Results: PAT Up 34%, On-track to FY26 Guidance
Revenue guidance of 50-60% growth in FY26, followed by 30-35% on the back of PM-KUSUM 2.0. Valuations provide upside opportunity but policy dependence is a risk
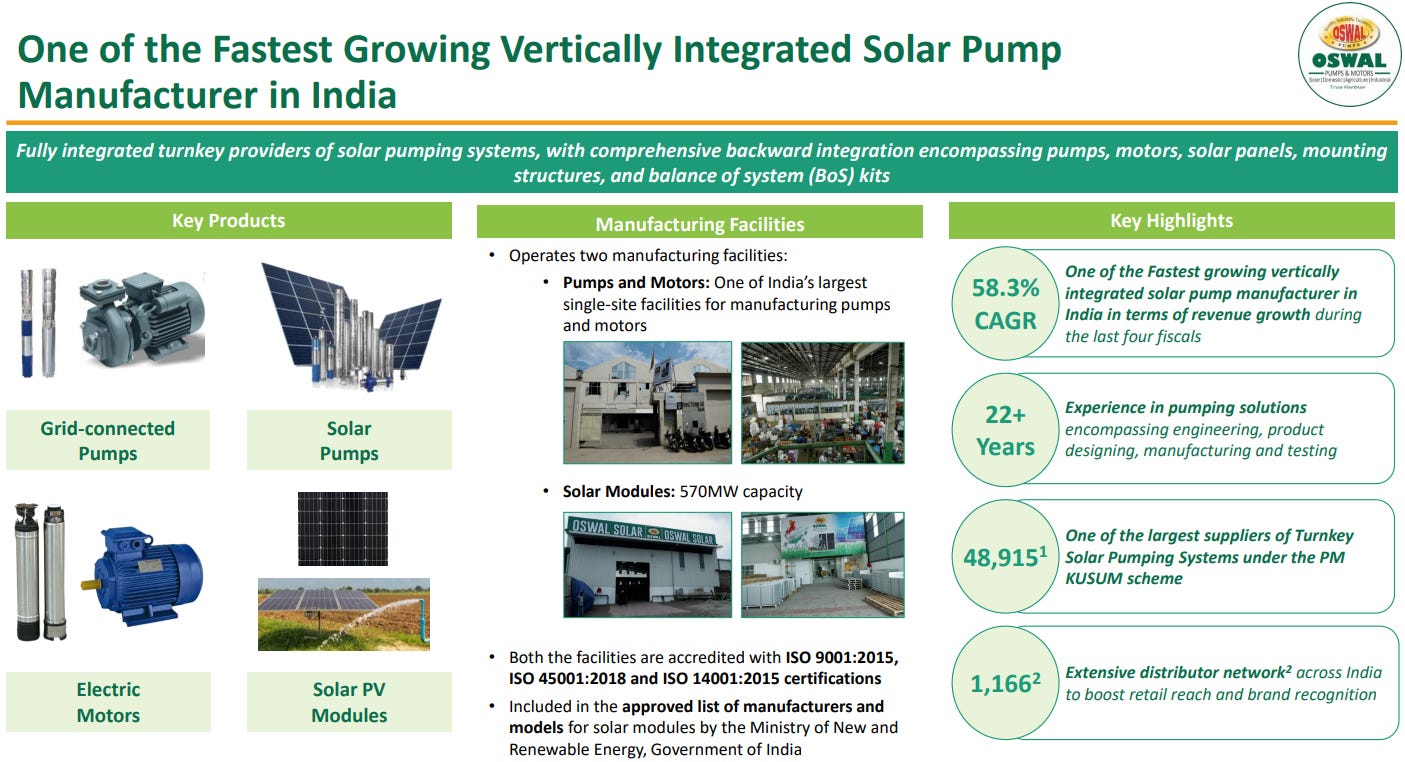
1. Pumps and Motors Manufacturer
oswalpumps.com | NSE: OSWALPUMPS
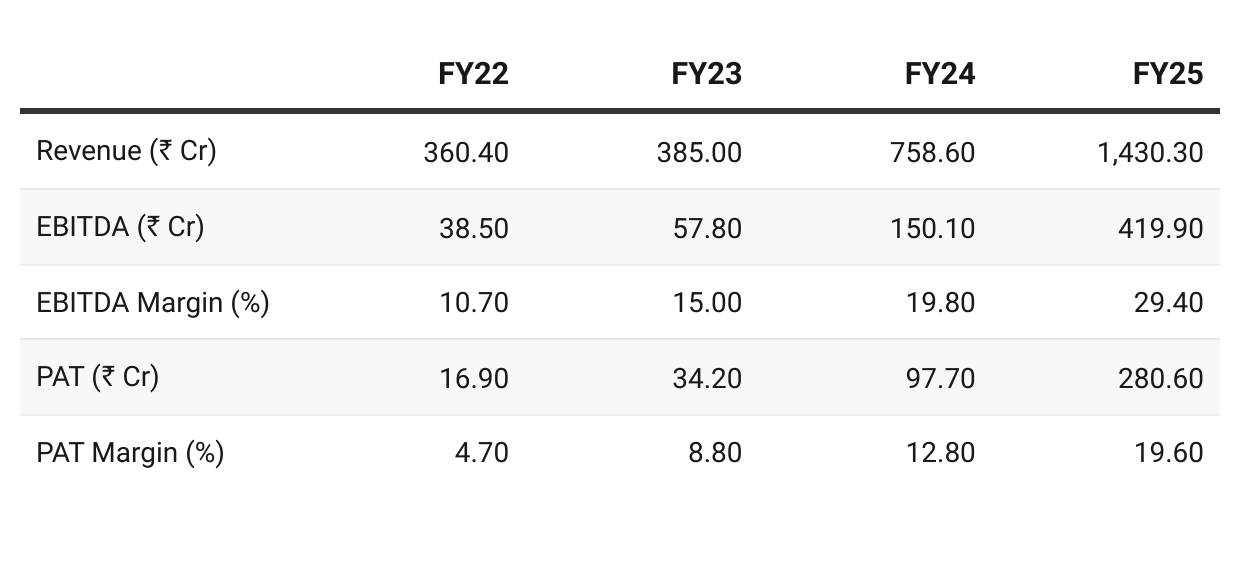
2. FY22–25: PAT CAGR 45% & Revenue CAGR 31%
Riding the tailwinds generated from the PM Kusum Scheme
In 2021, we began offering Turnkey Solar Pumping Systems, which include solar-powered agricultural pumps, solar modules, mounting structures, pump controllers, and installation services. These are provided either directly or through third-party bidders under the PM Kusum Scheme. As of June 30, 2025, we have successfully executed 48,915 Turnkey Solar Pumping System orders directly under the PM Kusum Scheme.
Considering both direct and indirect supplies under the scheme, Oswal Pumps’s Life-to-Date market share was at 31%
3. FY25: PAT up 167% & Revenue up 71% YoY
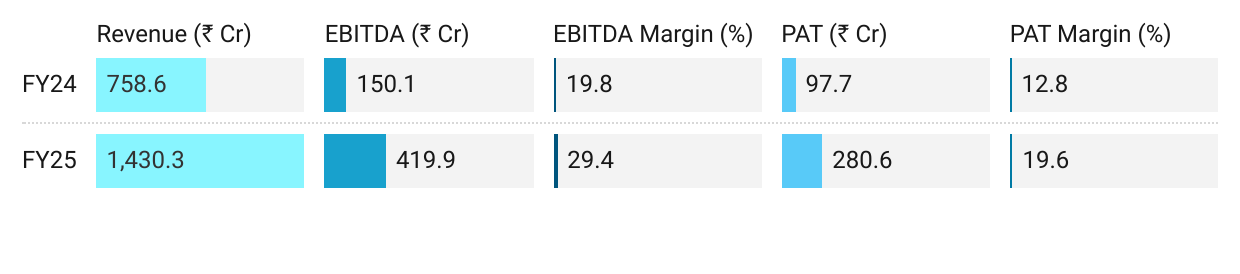
Revenue Growth: Driven by surge in PM-KUSUM turnkey solar pumping systems, especially in Maharashtra & Haryana.
Solar pumps (direct + indirect under KUSUM) contributed ~₹10,566 Mn (74%+ of revenue).
Shift in market mix:
Maharashtra: 48.1% of revenue (up sharply from 7.9% FY24, driven by Magel Tyala scheme).
Haryana: 29.2% (down from 72.3% FY24).
Margin expansion from higher mix of direct KUSUM turnkey sales (higher-margin vertical).
Q4 FY25 EBITDA margin dipped (27.1% vs 29.4% full-year) due to higher share of low-margin module sales vs turnkey pumps.
4. Q1-26: PAT up 34% & Revenue up 37% YoY
PAT up 48% & Revenue up 41% QoQ
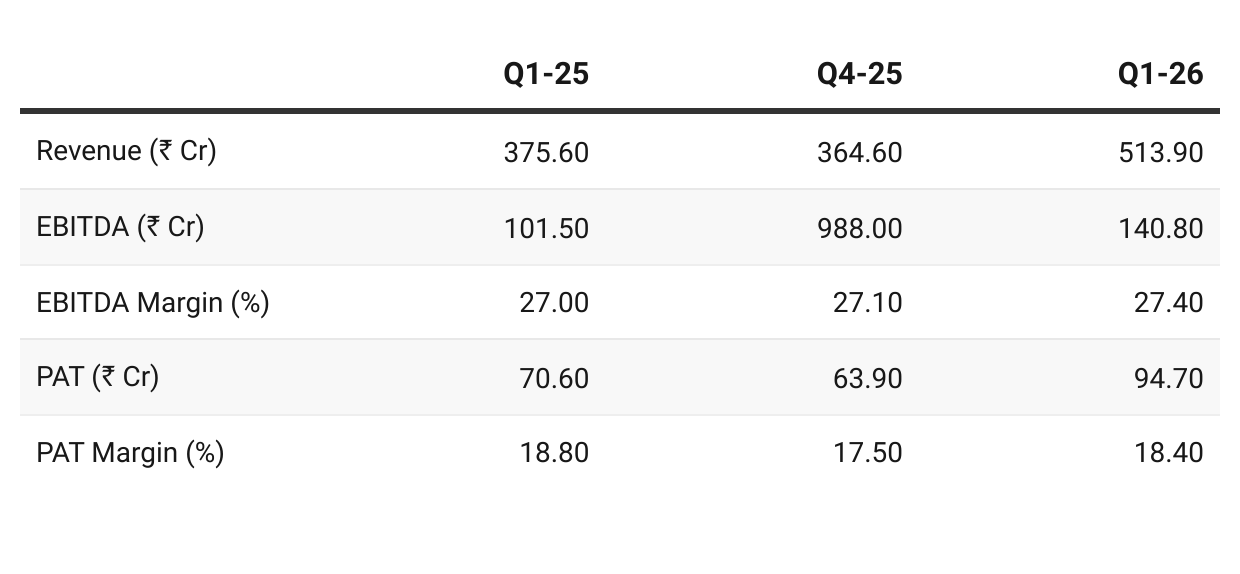
Strong start to FY26 – Q1 delivered ₹513.9 Cr revenue (≈23% of full-year target).
Margins stable – despite scale-up, operating leverage + backward integration kept EBITDA at 27.4%.
Balance sheet reset – IPO proceeds repaid debt, turning net cash positive.
Order visibility secure – ~30k pumps in backlog + state-level schemes ensure execution runway for FY26.
Risks: Receivable cycle (126 days), quarterly margin swings from product mix, heavy dependence on PM-KUSUM rollout.
5. Business Metrics: Strong Return Ratios
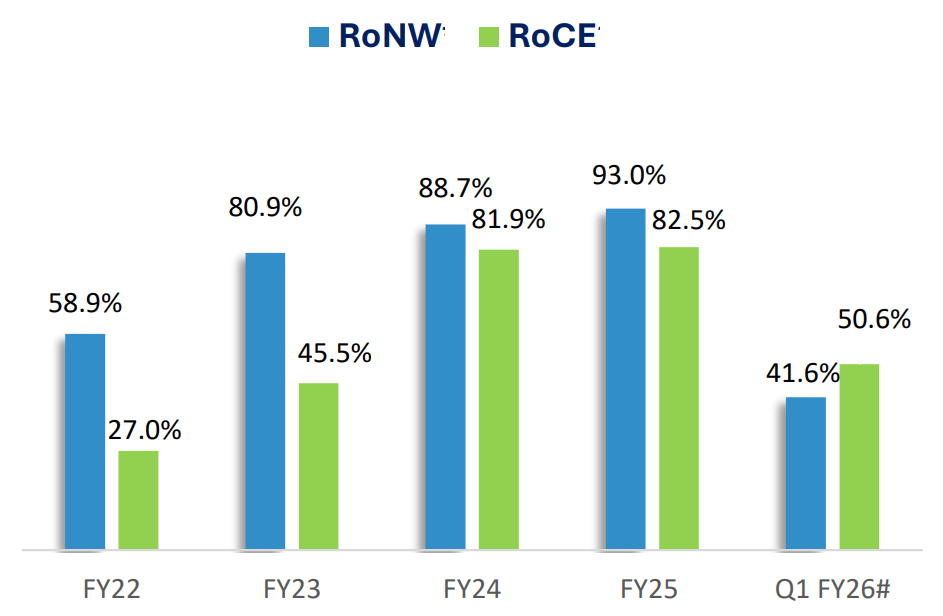
Capital Infusion in Q1-26 (# annualized)
Despite the capital infusion, the Company’s Return on Net Worth (RoNW) and Return on Capital Employed (RoCE) remains strong at 41.6% and 50.6% , respectively.
6. Outlook: 50-60% Growth in FY26
6.1 FY26 Guidance — Oswal Pumps
50-60% revenue growth with stable margins in FY26
For FY’26, we are targeting revenue growth in the range of 50% to 60%, with a medium-term goal of maintaining a CAGR of 30% to 35%.
We are guiding for operating EBITDA margin in the range of 27% to 29% and PAT margin between 18% to 20%.
Importantly, we are also anticipating the launch of PM-KUSUM 2.0 by the end of this fiscal, and we expect it to be larger in scope compared to the first phase.
By FY26-end, Oswal will have:
Pump capacity: expanded to >5 lakh units (vs ~2 lakh currently).
Solar module capacity: ~2.1 GW (vs 570 MW currently).
This ensures Oswal is ready to absorb KUSUM 2.0 demand without bottlenecks.
Beyond KUSUM:
Private Market: Farmers increasingly find solar pumps cheaper than grid pumps (₹3.5 lakh vs ₹5 lakh for 10HP connection). Loan availability (97% SBI tie-up) supports demand even without subsidies
Exports: Currently ~3–4% of revenues; targeted to grow at 40–50% annually.
Industrial Pumps: New launches (helical, chemical, boiler feed) expected from Q3 FY26 → gradually building a second growth engine beyond agri-solar.
6.2 Q1 FY26 Performance vs FY26 Guidance
Revenue Growth
Q1 achieved 23% of mid-point of 50-60% growth guidance.
With ~30,000 pumps order book executable in Q2–Q3, revenue trajectory is on track to meet guidance.
Margins
Both EBITDA at 27.4% & PAT at 18.4% are at the lower end of margin guidance
One needs to watch out for slippages
Management confident of meeting margin guidance
Order Book & Execution
Q1 Order Book of 30,000 pumps (₹700–800 Cr).
Full execution cycle in 120–150 days → ~2 quarters visibility.
Current backlog ensures revenue visibility for Q2–Q3.
KUSUM-2 expected by end-FY26 will drive incremental H2 orders.
Verdict: Q1 FY26 performance validates management’s FY26 guidance, with revenue visibility and margin discipline largely de-risking the outlook.
7. Valuation Analysis
7.1 Valuation Snapshot — Oswal Pumps
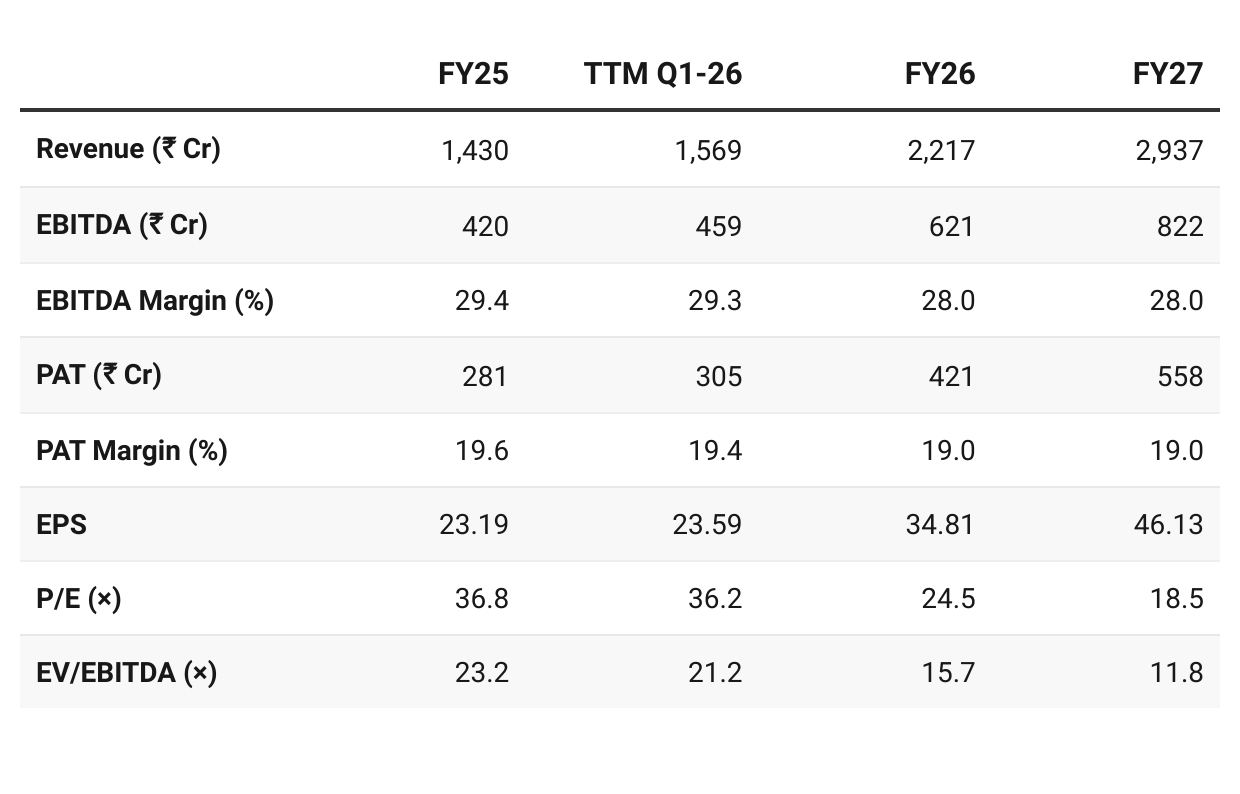
CMP ₹853.5; Mcap ₹9,725.37 Cr
Revenue, EBITDA Margin, PAT Margin based on mid-point of guidance range.
High-Growth → Premium to Reasonable Valuation Transition:
Oswal’s current multiples look expensive (36× P/E in FY25), but rapid earnings growth compresses valuations to sector-comfortable levels by FY27.
Valuation become really attractive if medium-term guidance of 30-35% growth plays out in FY28
Verdict: Oswal Pumps is evolving from a premium “growth story” into a sustainable growth + reasonable valuation play.
7.2 Opportunity at Current Valuation
Strong Management Guidance — Growth Visibility
Strong revenue guidance over FY26 and FY27, which could continue into FY28:
Expanding distributor network (1,166+) and Oswal Shoppe retail footprint.
Growth supported by strong and stable margins
Catalysts
PM-KUSUM 2.0 expected to be larger in scope compared to the first phase.
Launch of industrial pump portfolio (helical, chemical, boiler feed) from Q3 FY26.
Exports scaling at 40–50% annually, though still a small base about 4-5%.
Valuations Normalization: Current valuation still factors in growth, but rapid earnings compounding and sector tailwinds make Oswal attractive as a high-growth + margin-resilient play transitioning to reasonable valuations by FY27.
7.3 Risk at Current Valuation
Policy Dependence
~70–75% of revenue from PM-KUSUM scheme; delays in KUSUM 2.0 or subsidy disbursal could hit execution.
Execution Risk
Receivable cycle stretched at ~126 days, leading to working capital stress.
Quarterly margin volatility possible (e.g., Q4 FY25 EBITDA dipped to 27.1% vs 29.4% full-year) due to sales mix.
Valuation Risk
Despite compression, FY26E P/E at 24.5× and EV/EBITDA at 15.7× remain premium vs some capital goods peers. However, if momentum continues into FY28 as per medium term guidance then valuations become attractive.
If growth slows on account of policy or execution premium may not sustain, risking de-rating.
Competitive Pressure
Larger industrial and renewable players could enter the solar pump space.
Price-based competition in large tenders could pressure realizations.
Macro Risks
Farmer financing (97% loan model) dependent on banks and interest rate environment.
Raw material price fluctuations (aluminium, copper, solar module inputs) may affect cost if integration lags.
Verdict: While Oswal enjoys sector leadership and strong growth, policy reliance, receivable risks, and premium valuations could limit upside or trigger corrections if execution falters.
Don’t like what you are reading? Will do better. Let us know at hi@moneymuscle.in
Don’t miss reading our Disclaimer