
1. TL;DR:
NSE not cheap on its own:
42.1× TTM earnings
~2.3% adjusted FY26 FCF yield.
Cheaper than BSE:
42.1× vs ~49× TTM P/E
BSE is growing much faster, so part of that discount is justified.
Pricier than most global exchanges:
CME and ICE trade near 22–23×
Other major exchanges generally below NSE’s 42× valuation.
The question: Does NSE’s dominance, margins and network effects justify paying 42× earnings when BSE is growing faster and global peers are cheaper?
Our view: Exceptional business, fair price — not a bargain.
2. NSE IPO Details
Because this is a pure OFS, there is no dilution from new shares, but NSE also receives none of the IPO proceeds.
Existing shareholders selling 12.64 Cr shares, reduced from the 14.89 Cr shares proposed in the June DRHP.
Price band ₹1,700–1,785
At ₹1,785 — issue is worth ₹22,569 crore
Minimum investment @ ₹1,785 = ₹14,280 (lot size of 8 shares )
IPO opens: September 17, 2026
IPO closes: September 21, 2026
Market cap at ₹1,785 ~₹4.42 lakh crore
Listing exchange: BSE
3. NSE Financials: PAT 11% & Revenue 6% CAGR FY24-26
3.1 FY25 Boom, FY26 Reset
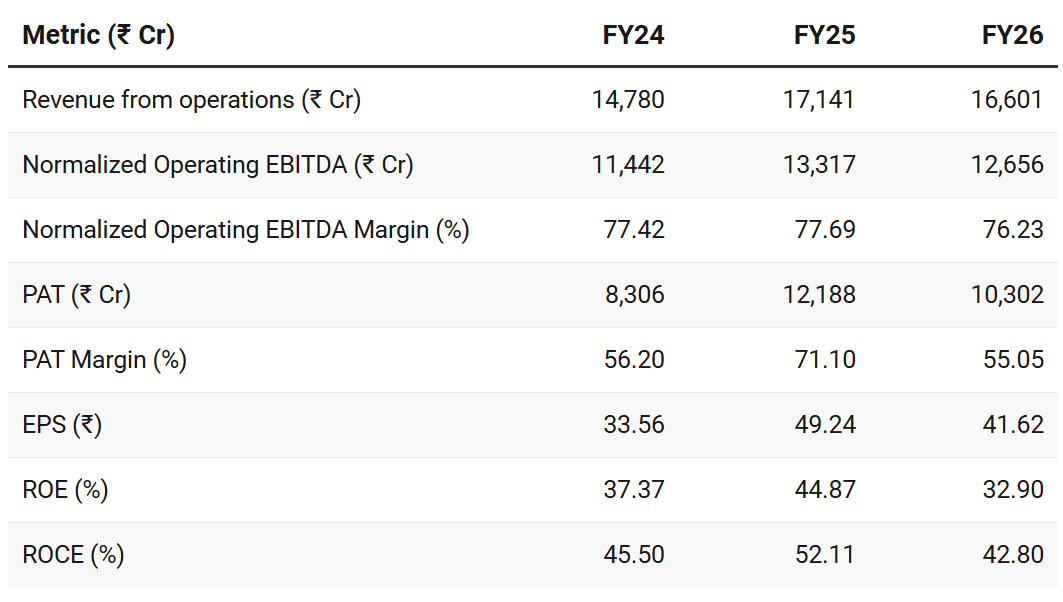
Trading activity weakened across major segments in FY26.
Cash-market ADTV fell around 6.6%
equity-futures ADTV around 14.2%
options-premium ADTV around 7.7%.
Transaction-charge revenue consequently declined.
This fits the broader slowdown after regulatory measures tightened India’s derivatives market.
Reported EBITDA includes income beyond the core exchange operation, while NSE’s normalized operating measure adjusts for items including associate gains and regulatory costs. We therefore use reported EBITDA for historical performance and normalized operating margins as a check on underlying profitability.
3.2 Is NSE’s Earnings Slowdown Reversing?
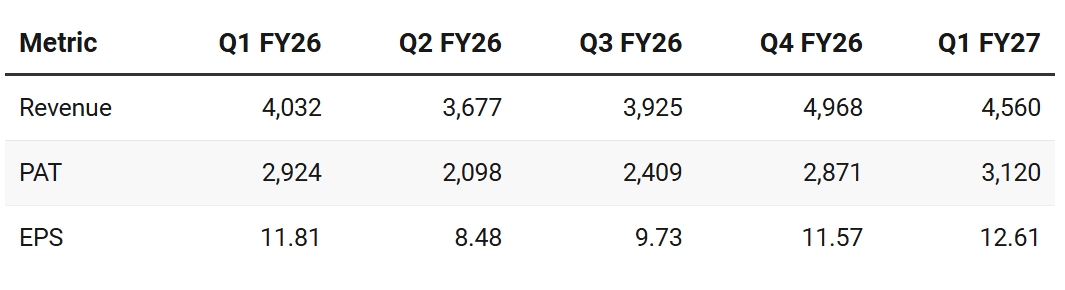
Q2 FY26 was the trough.
PAT has since recovered from ₹2,098 Cr to ₹3,120 Cr
In Q1 FY27, revenue from operations grew 13.1% YoY to ₹4,560 crore, operating EBITDA grew 15%, and PAT increased 6.7% to ₹3,120 crore. EPS rose from ₹11.81 to ₹12.61.
That’s encouraging, but Q1 revenue was still below Q4 FY26.
The trend is best described as:
FY25 boom → FY26 slowdown → early FY27 recovery.
4. Absolute Valuation:
All valuation calculations below use the ₹1,785 upper end of the IPO price band.
4.1 Is a PE of 42× Earnings Too Much?
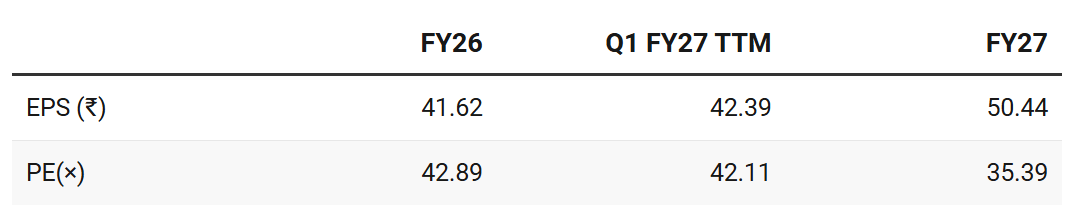
NSE’s Q1 FY27 TTM P/E = 42.1×
That is clearly a premium valuation.
Lower end of price band at ₹1,700 still implies ~40× TTM earnings.
There is no obvious margin of safety in the short term from P/E.
NSE’s FY27E P/E = 35×
Annualized Q1 FY27 EPS = ₹12.61*4 = ₹50.44
That is more reasonable, but still not obviously cheap.
4.2 What Does Free Cash Flow Say?
For NSE, reported operating cash flow is distorted by large movements in clearing-member margins and settlement obligations.
So conventional CFO minus capex overstates shareholder-available free cash flow.
A more useful analytical proxy is:
PAT + depreciation & amortisation − regular capex
For FY26:
₹10,302 Cr PAT + ₹624 Cr D&A − ₹587 Cr capex = ~₹10,339 Crore
That implies:
Adjusted FCF yield ≈ 2.34%
and:
Price / adjusted FCF ≈ 42.7×
Including the ₹926 crore MMRDA land advance lowers the FCF yield to roughly 2.1%, but that isn’t recurring capex.
The takeaway is straightforward:
FCF doesn’t reveal hidden cheapness. NSE is valued at roughly 42–43× both earnings and adjusted FCF.
4.3 How are Forward Valuations Looking for NSE?
If NSE sustains its Q1 FY27 EPS of ₹12.61 through the year, FY27 EPS would be around ₹50.44.
That would mean roughly:
21% EPS growth over FY26
and:
35.4× earnings at ₹1,785
A 35× P/E can be reasonable for a high-quality market leader growing earnings at 20%+.
But there is a catch.
FY27 is a recovery year off a weaker FY26 base.
Sustaining 20%+ EPS growth every year through FY30 would be a much harder ask.
And because NSE already commands a premium valuation, there may be limited room for further P/E expansion.
The investment case therefore depends increasingly on earnings growth rather than re-rating.
If earnings growth slows after FY27 while the P/E compresses, much of the operating growth may not translate into shareholder returns.
Investors buying NSE are therefore betting on both continued earnings growth and continued premium valuation.
5. Relative Valuation: NSE vs BSE
BSE is the most relevant Indian peer for NSE
BSE has more listed companies and a stronger SME IPO count.
But NSE is larger where trading liquidity and monetisation matter.
Its cash-market ADTV is more than 13× BSE’s, revenue is around 3.4× larger, and passive assets linked to NSE indices are more than three times BSE’s.
NSE is the dominant incumbent.
BSE is the faster-growing challenger.
That distinction explains much of the valuation gap.

The large FY26 valuation discount narrows on FY27 earnings.
NSE gives investors greater scale and dominance.
BSE gives investors much faster current growth.
On forward earnings, investors may be paying fairly similar multiples for those two different profiles.
6. NSE vs Global Exchange Valuations
Global exchanges aren’t perfect peers.
Companies such as Nasdaq and LSEG have larger data, technology and index businesses, while mature markets have very different growth profiles. NSE’s DRHP itself warns that global exchange comparisons aren’t directly like-for-like.
Still, they are useful as a valuation reality check against NSE at 42.1×
Approximate TTM P/E as of early September 2026:
Singapore Exchange~38×
LSEG~32×
Nasdaq~27×
CME~23×
Cboe~23×
ICE~22×
NSE therefore trades at a premium to almost every major global exchange operator.
That premium may be justified by India’s faster capital-market growth, NSE’s dominant market share and unusually high profitability.
But it reinforces one point:
42× is a premium exchange valuation.
BSE makes NSE look cheaper.
Global peers make NSE look expensive.
7. NSE IPO: Is ₹1,785 a Fair Price?
The answer depends on what you compare it with.
TTM P/E of 42.1× — Not cheap
Adjusted FCF yield ~2.3% — Not cheap
NSE vs BSE FY26 — Looks attractive
NSE vs BSE TTM — Moderately attractive
NSE vs BSE FY27E — Little valuation advantage
NSE vs global exchanges — Expensive
So we wouldn’t call NSE undervalued.
But neither does ₹1,785 look unreasonable for a franchise of this quality.
The main risk is multiple compression: NSE’s earnings may grow, but if the P/E falls at the same time, much of that growth may not translate into shareholder returns.
8. Our View:
NSE is an exceptional business at a fair price — not a bargain.
At ₹1,785, there is more value on a relative basis than on an absolute basis, but even that relative advantage becomes less compelling once BSE’s faster growth and global exchange valuations are considered.
Don’t subscribe simply because it is NSE.
A great company bought at the wrong price can still be a mediocre investment.
At ₹1,785, NSE looks fairly priced for its quality—not obviously mispriced in your favour.
For eligible employees, the ₹170 discount improves the equation materially. At an effective price of ₹1,615, NSE trades at approximately 38.1× TTM earnings, giving employees a much better starting valuation.
If you want to share any suggestions about the MoneyMuscle, or if there are any specific stocks you’d like us to cover, just send an email to hi@moneymuscle.in
Don’t miss reading our Disclaimer