
Nava FY25 Results: PAT up 14%, Outlook of Strong Cash Generation
Strong cash generation supported by Q4-25 equity buyback at reasonable valuations with underlying businesses providing a stable outlook of growth in FY26 and beyond
1. Diversified Businesses Energy, Mining, Metals, Agribusiness & Healthcare
navalimited.com | NSE : NAVA

Business Segments

2. FY21–25: PAT CAGR 27% & Revenue CAGR 11%

2.1 Business Evolution: FY21–FY25
Zambia became core: From a stressed asset to Nava’s cash-generating and strategic hub
Energy dominates: Maamba’s 300 MW runs at high PLF with stable PPA; Phase-II & solar under execution
Ferro alloys repositioned: Shifted focus to ferro silicon; targeting export markets like Japan/US for better margins
Agri vertical launched: Avocado & sugar projects underway in Zambia to create long-term value beyond core ops
Critical minerals push: Exploration of lithium and manganese in Zambia and Ivory Coast initiated
India rationalized: Moved 60 MW of Odisha capacity from captive to IPP; paused low-return expansions

3. Q4–25: PAT up 14% & Revenue up 10% YoY
PAT down 15% & Revenue up 21% QoQ

Strong Revenue Recovery in Q4
Bounce-back in Indian ferro alloys and power segment
Zambia energy operations remained steady despite planned shutdowns
EBITDA Margin Dip QoQ
Due to MEL shutdown and seasonal mix shift
Margin impact temporary; underlying business remains strong
Business Visibility Strong for FY26
60% of Zambia power already contracted till Sep 2025
Ferro alloys supported by export demand, low-cost inventory
4. FY25: PAT up 14% & Revenue up 4%

Strong cash generation: PAT crossed ₹1,400 Cr as MEL turned debt-free and began regular upstreaming of cash.
Zambia-led profitability: MEL contributed over 65% of group EBITDA, driven by 90%+ PLF and full tariff realization.
Margin expansion: EBITDA margin improved 110 bps YoY — driven by energy segment strength and reduced finance costs.
Buyback + Dividend = ₹725 Cr: ₹360 Cr buyback (2.6x oversubscribed) + ₹10/share dividend declared.
Growth capex in motion:
Maamba Phase II (300 MW) under construction
100 MW solar project initiated
Agri & mining bets (avocados, sugar, lithium, manganese) progressing
5. Business Metrics: Stable Return Profile
Consistent return improvement driven by debt reduction, high-margin energy operations, and disciplined capital allocation

Sustained profitability: ROCE improved ~450 bps between FY21 and FY25 as Zambia operations scaled up, debt reduced, and working capital cycles normalized.
High-quality earnings: FY25 ROE improved to 18.0%, supported by strong PAT generation, reduced finance costs, and stable equity base post buyback.
Disciplined capital use: Net debt moved to net cash territory in FY25; capital employed grew selectively with sharp focus on asset efficiency.
Resilient outlook for FY26:
Zambia Phase-II and solar to start capex ramp-up
Ferro alloys rebounding
Agri and mining initiatives add medium-term optionality without diluting core returns
6. Outlook: Strong Cash Generation
6.1 FY25 Expectations vs Performance — Nava Ltd

✅ Hits: What Went Right
PAT up 14% YoY despite tepid top-line growth
MEL is now debt-free and consistently upstreaming cash to India
100 MW solar project secured with long-term tariff certainty
₹725 Cr returned to shareholders via buyback + dividend
Diversification into agri and mining progressing steadily
Ferro alloys portfolio de-risked via ferrosilicon exports
❌ Misses: What Fell Short
Revenue growth slowed to 4.3% vs 14% CAGR in FY21–24
EBITDA margin dipped in Q4 due to scheduled MEL shutdown
Ferro alloys India ops lost money in H1; full-year profitability muted
Nacharam land monetization deferred amid rising real estate cycle
New verticals (agri, mining) are still pre-revenue — no near-term contribution
6.2 Outlook for FY26 and Beyond
🔭 FY26 Priorities & Growth Levers
Maamba Phase-II (300 MW)
→ Construction in full swing; expected commissioning by Aug 2026
→ Will double thermal capacity in Zambia, backed by PPA at $0.095/kWh100 MW Solar Project
→ ZESCO PPA signed; pre-construction activities underway
→ Positions Nava in low-carbon energy with stable cash flowsFerro Alloys Rebound
→ Improved global demand and ferrosilicon exports to the US/Japan
→ Cost visibility secured via low-cost manganese ore stock till Sept '25Agri Business Maturity
→ First avocado harvest in FY26-end; ~1.9 lakh trees to be fully planted
→ Sugar cultivation to commence; packhouse and infra investments to scaleCritical Minerals Optionality
→ Lithium, magnetite, manganese exploration in Zambia and Ivory Coast
→ Targeting long-term value creation through resource-linked investments
📈 Financial Outlook
Expect strong PAT growth as:
Zambia operations continue to upstream cash
Indian ferro alloys return to full-year profitability
Interest burden remains negligible due to net cash position
Capex to accelerate but fully funded via internal accruals
FY26–FY27 outlay includes: Maamba II, solar, agri, and mining development
Capital return focus to continue
→ Buyback/dividend policy likely to stay active
→ ROCE expected to remain resilient despite asset build-up
🧭 Strategic Positioning
Transitioning from a single-country, dual-segment company
→ To a multi-country, multi-engine growth platform across:Power (thermal + solar)
Ferro alloys (India)
Agri exports (Zambia)
Resource mining (Africa)
FY26 will be a bridge year, laying operational foundation for
material revenue expansion starting FY27
7. Valuation Analysis — Nava Ltd
7.1 Valuation Snapshot (FY25)

Fairly Valued on P/E and EV/EBITDA
P/E of 16.2x and EV/EBITDA of 8.4x suggest the stock is not cheap, but also not overvalued. Given:
35%+ PAT margins
Debt-free status
Recurring cash from Zambia
This valuation appears justified.
Premium P/S Ratio Reflects Quality of Earnings
P/S of 4.3x is high — but deserved because:
Large portion of revenue is from long-term contracted power (MEL)
Business model is capital-efficient and high-margin
Strong FCF Yield Indicates Undervalued Cash Generation
FCF Yield of 7.6% is attractive:
Suggests Nava could comfortably sustain or grow dividends/buybacks
Market may not yet be fully pricing in its free cash flow power
Market Is Pricing in the Present, Not Future Optionality
Current multiples don’t reflect:
Avocado & sugar scale-up (FY27+)
Solar cash flows (post-FY26)
Maamba Phase II (starts FY27)
Lithium/manganese mining optionality
🚨 This suggests valuation upside remains if Nava executes well on its diversification bets.
Safe Margin of Safety via Balance Sheet
Net cash position (₹594 Cr) + ₹1,305 Cr FCF in FY25 → gives strong downside protection
Can fund all growth capex without equity dilution or leverage
Nava’s current valuation reflects strong core business execution but not yet the optionality of future projects.
It's a case of “quality at fair price” with embedded optionality — not fully priced in yet
7.2 What’s in the Price?
The market is pricing in:
FY26 Profit Stability: Zambia upstreaming continues; PAT expected to remain above ₹1,400 Cr
High Margin Base: PAT margins staying above 30% with no major margin compression expected
Buyback + Dividend Discipline: ₹725 Cr returned in FY25 seen as sustainable
No Working Capital Blowout: Stable cash generation from MEL + zero leakage assumption
MEL Fully Derisked: Debt-free, sovereign PPA backed; risk premium removed
Implied Valuation Assumptions:
MEL and Indian energy operations valued on EV/EBITDA of 8–10x
Ferro alloys business normalized at low double-digit ROCE
No significant value attributed to agri, mining, or solar yet
Reinvestment of cash flows assumed to be value-neutral
7.3 What’s Not in the Price?
The stock does not yet price in optionality from:
Agri Upside (Avocados & Sugar)
→ First harvest expected FY26-end, not in Street models
→ Potential for export-linked cash flow not factoredMaamba Phase-II (300 MW)
→ Construction on track; ₹2,000 Cr+ value accretive at current tariffs, but not priced inSolar Project (100 MW)
→ ZESCO PPA signed; long-term earnings visibility ignored by the market for nowMining Concessions
→ Early-stage lithium/manganese potential in Zambia and Côte d'Ivoire offers structural upsideValuation Re-rating
→ Current valuation driven by earnings — no multiple expansion priced in
→ Re-rating to 20x P/E or 10x EV/EBITDA could re-rate stock by 20–25%
7.4 Risks and What to Monitor
Despite healthy FY25 results, these are the key risks that could cap or reverse valuation momentum:
Execution Risk
Phase-II Maamba delays — commissioning slippage beyond FY26 could defer earnings ramp-up
Agri ramp-up risk — delays in export infra (packhouse, logistics) could dilute RoIC
External Volatility
Ferro alloy pricing swings, especially in manganese and ferrosilicon
ZESCO payment disruptions, though sovereign guarantees offer some protection
FX movement impact on Zambia remittances
What to Monitor

8. Implications for Investors
8.1 Bull, Base & Bear Scenarios — Nava Ltd
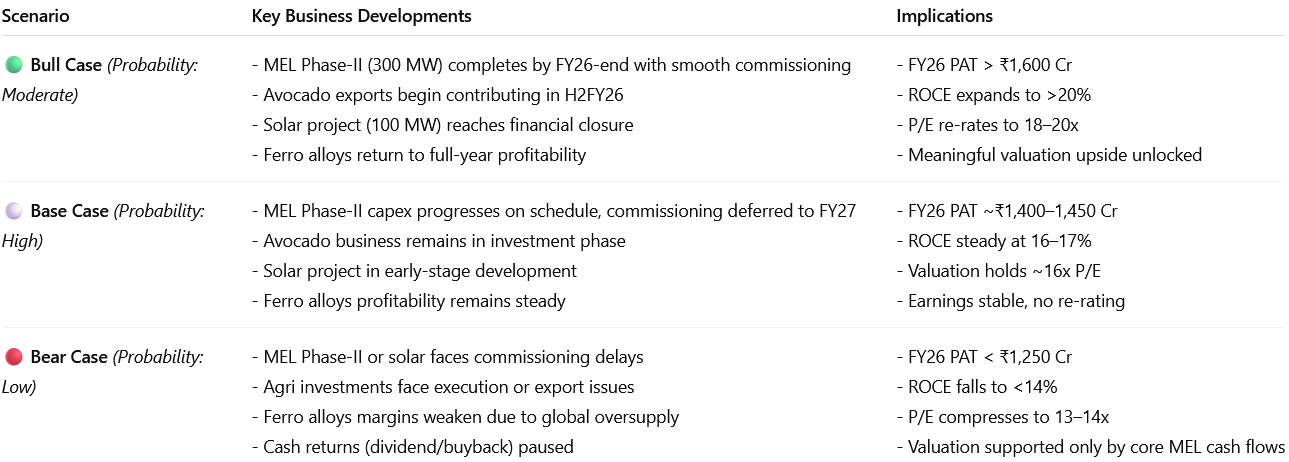
Base Case reflects strong core earnings from MEL and Indian power assets, with optionality from agri and solar not priced in.
Bull Case depends on on-time execution of MEL Phase-II and agri/solar monetization.
Bear Case reflects execution slippage, not structural decline — core Zambia power still offers valuation support.
8.2 Is There Any Margin of Safety?
✅ Where There Is Margin of Safety
Business Model Strength
Cash-generating core (MEL): Zambia thermal asset has high PLF, dollarized PPA, and zero debt — generates predictable cash flows
High-margin structure: PAT margin at 34.7% in FY25, driven by energy, not low-margin commodity exposure
Geographic diversification: Zambia, India, and Africa expansion reduce country-specific regulatory risk
Limited dependence on commodity prices: Ferrosilicon export focus de-links earnings from steel cycle
Capital Structure
Net debt negative (₹595 Cr net cash) as of FY25 — zero leverage risk
₹1,305 Cr of free cash flow in FY25 can comfortably fund MEL Phase-II, solar, and agri capex without dilution
Buyback and dividend of ₹725 Cr show strong capital return intent
Execution Upside Not Yet Priced In
MEL Phase-II (300 MW): ₹2,000 Cr capex in progress — commissioning in FY27 can double power revenues
Avocado/sugar exports: ~1.9 lakh trees planted; first harvest in FY26-end — not reflected in estimates
Solar (100 MW): PPA signed, construction expected to begin FY26 — provides ESG re-rating trigger
Lithium/manganese exploration: Early-stage optionality in African minerals — no value yet assigned
Valuation to Earnings
Valuation not expensive: 16.2x P/E and 8.4x EV/EBITDA despite net cash and consistent FCF
FCF yield of 7.6% adds downside cushion
❌ Where There Isn’t Much Margin of Safety
Valuation Depends on Steady Execution
Current multiples assume stable FY26 PAT > ₹1,400 Cr — any slippage (FERRO, MEL, agri) could trigger de-rating
Street may not tolerate margin compression from:
Cost overruns in MEL Phase-II
Agri delays or packhouse/export inefficiencies
Solar project slippage or tariff renegotiation
Execution Risks Remain
Ferro alloys earnings fragile — rebounded in FY25, but still volatile
Agri projects pre-revenue — infra, logistics, export compliance all untested at scale
Solar execution risk — site readiness and funding timeline not fully de-risked
New mining projects (lithium, manganese) in Zambia/Ivory Coast are long-tail bets — no cash flows till FY28+
Nava’s FY25 exit leaves it with strong fundamentals and visible earnings — but FY26–27 execution must be near-flawless to unlock optionality and avoid compression.
Don’t like what you are reading? Will do better. Let us know at hi@moneymuscle.in
Don’t miss reading our Disclaimer