
Man Industries FY25 Results: PAT Up 46%, FY26 Set for 25%+ EBITDA Growth
Strong growth till FY28 on new capacities, export momentum, margin gains from Saudi & Jammu ramp-up & land monetization. Undemanding valuations create opportunity
1. LSAW, HSAW, and ERW pipes
mangroup.com | NSE: MANINDS
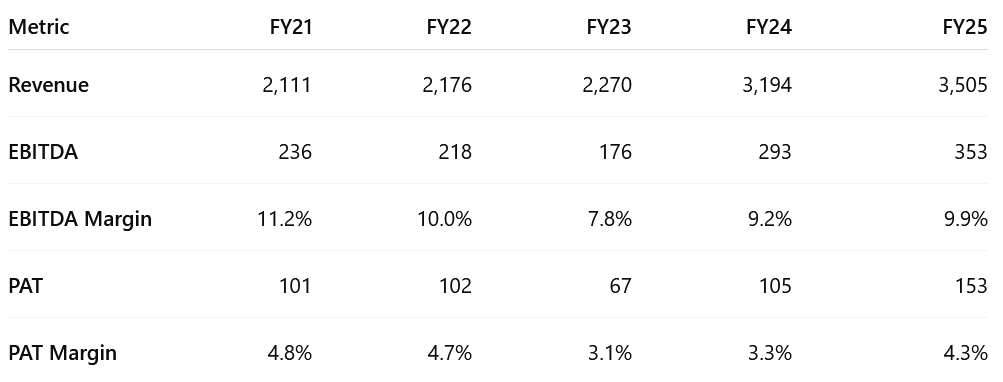
2. FY21-25: PAT CAGR 11% | Revenue CAGR 14%
2.1 What Changed Between FY21–25
A. Strategic Shifts & Capacity Expansion
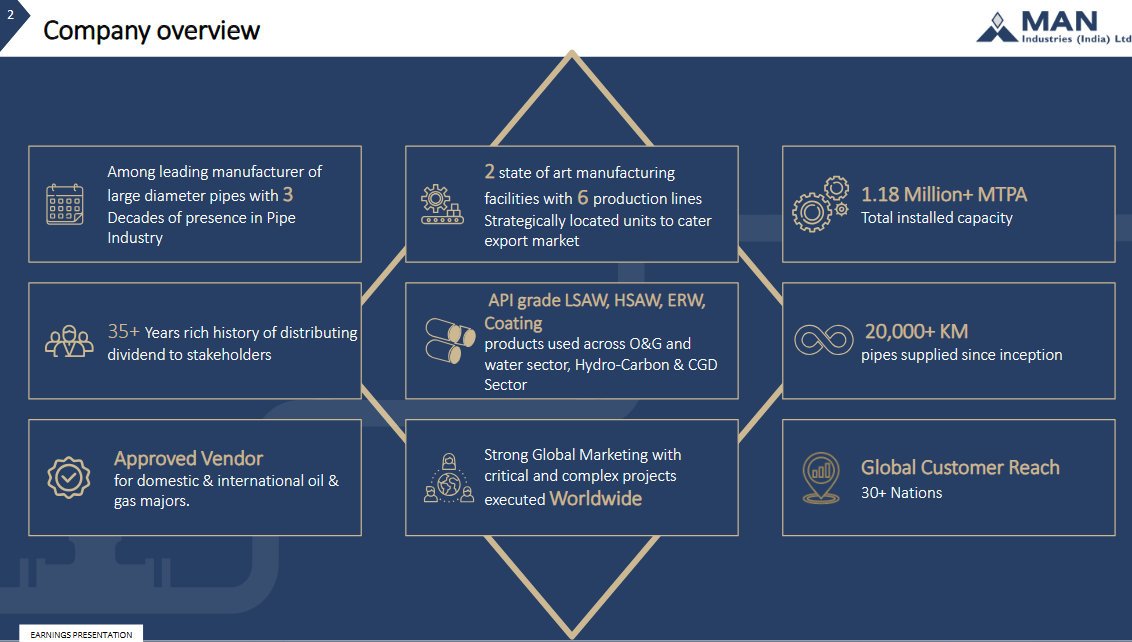
Capacity expanded to 1.18 MTPA, with new ERW lines and spiral mill.
New Verticals:
ERW Pipes launched in FY23–24; now ~10% of revenue.
Jammu (SS Seamless Pipes): High-margin (20–25%), to commercialize by Q3 FY26.
Saudi (H-SAW + Coating): Export-focused, Q3 FY26 launch.
Value Addition: Backward integration into bends, coatings, and large-dia customization.
B. Export Focus & Order Book
Exports rose to 75–80% of revenue (vs. ~50–60% in FY21).
Bid Book expanded to ₹15,000 Cr with better global qualification.
Order Book at ₹2,500 Cr: leaner, more profitable (12–14% vs 8–10%).
C. Real Estate Monetization
Merino Shelters: ₹368 Cr booked via land + CWIP sale in FY25.
₹70 Cr upfront; ₹700 Cr expected over 5–6 years via 30% project share.
No operating costs; enhances cash flows and balance sheet.
D. Margin Trajectory
FY23 Dip: Margin pressure from weaker pricing and input cost inflation.
FY25 Recovery: Driven by better mix, execution, and other income.
E. Balance Sheet Improvement
Net Debt reduction with Net Debt / EBITDA improved from 1.1× to 0.5×, boosted by internal accruals and Merino proceeds.
3. Q4-25: PAT up 183% and Revenue up 50% YoY
PAT up 100% and Revenue up 67% QoQ
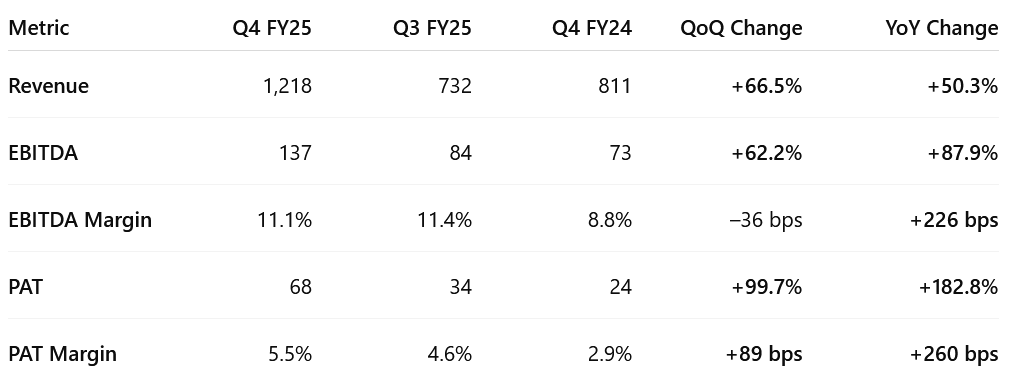
Strong Revenue: Driven by exports, value-added product scale-up & Q3 delays clearance
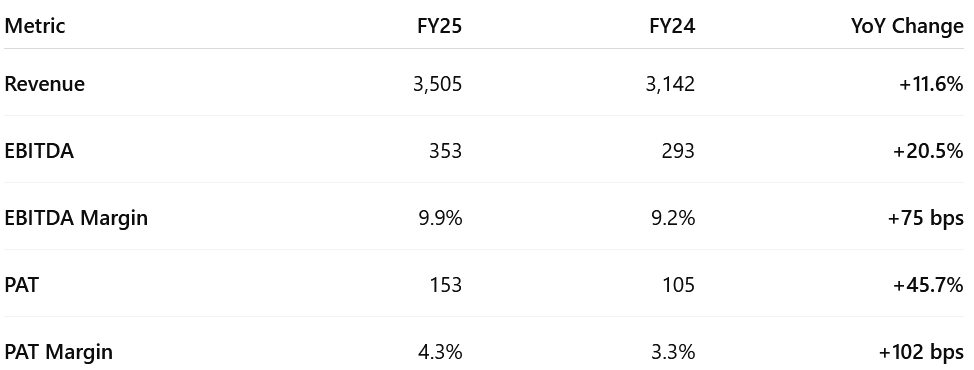
4. FY-25: PAT up 46% and Revenue up 12% YoY
Revenue Growth Moderated
Modest due to steel price softness and shipment delays in H1.
Strong H2 recovery, especially Q4, supported the annual topline.
Margin Expansion: Reflects better product mix and operating leverage.
Export-Led Model:
Exports formed 75–80% of total revenue
Strong traction in MENA and Far East.
Value-added ERW and coated pipe orders helped improve realizations.
Non-Core Gain Adds Upside
₹368 Cr revenue from Merino Shelters monetization recognized in FY25.
₹70 Cr upfront cash; ₹700 Cr expected over next 5–6 years from 30% area share.
FY25 sets the stage for FY26–27, as new capacity from Jammu and Saudi Arabia starts contributing.
5. Business Metrics: Strong & improving return ratios
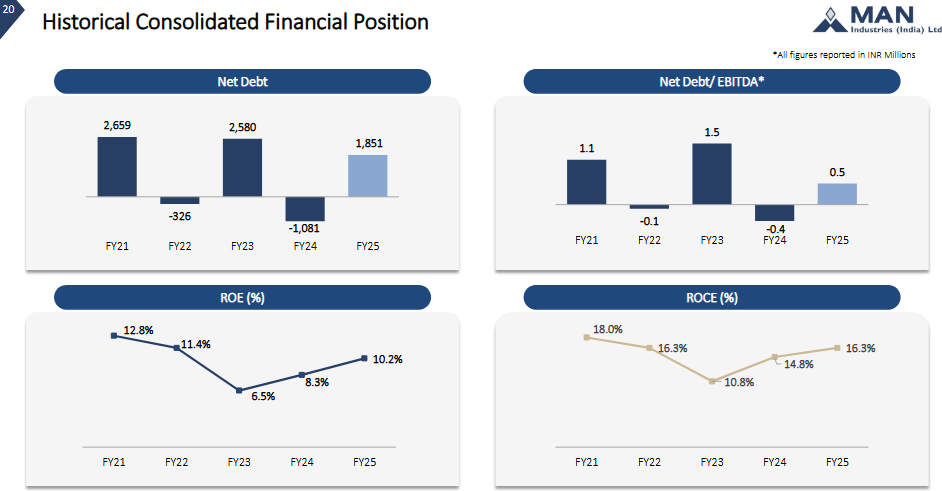
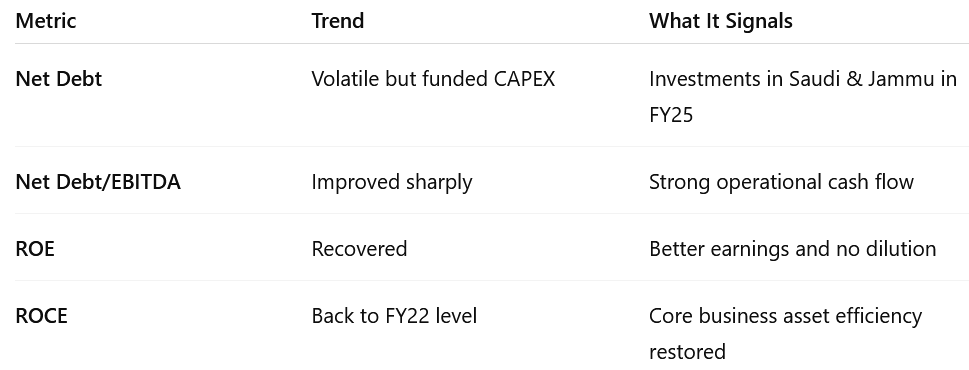
Net Debt: Volatile but funded CAPEX Investments in Saudi & Jammu in FY25
Net Debt/EBITDA. Improved sharply. Strong operational cash flow
ROE: Recovered. Better earnings and no dilution
ROCE: Back to FY22 level. Core business asset efficiency restored
6. Outlook: 30%+ Revenue CAGR over FY25–FY28
6.1 Man Industries – FY25: Expectations vs. Performance
Hits (What Went Well)
Revenue Beat: Delivered ₹3,505 Cr vs. ₹3,300 Cr guidance (up 11.6% YoY).
EBITDA Margin Expansion: Improved to 9.9% from 9.2% YoY, aided by high-margin export orders.
PAT Growth: 45.7% YoY growth, supported by both operational and monetization gains.
Export-Led Performance: 75–80% of revenue from exports; strong traction in MENA & Far East.
ERW Segment Scaling: ~₹350 Cr revenue (10% of topline); export-accredited and growing.
ROCE Rebound: Improved to 16.3% from 10.8% in FY23—driven by better capital use and profitability.
Net Debt/EBITDA Improved: Dropped to 0.5× despite CAPEX ramp-up.
Misses (Shortfalls)
Full-Year Growth Muted: FY25 revenue up only 11.6% despite strong Q4; H1 impacted by shipment delays and steel price softness.
ROE Still Below Peak: At 10.2% vs. 12.8% in FY21—reflects debt usage and tax impact.
Core Pipe Business Growth (~8% YoY): Slower compared to earnings growth, partly aided by one-off gains.
Caution (What to Watch in FY26)
Execution Risk on New Projects: Jammu & Saudi facilities expected to commercialize in Q3 FY26—any delay may impact FY26 targets.
Working Capital Buildup: Inventory and receivables rose in FY25; Q1 cash flow needs careful monitoring.
Merino Monetization is Staggered: ₹700 Cr inflow expected over 5–6 years—not guaranteed or linear.
Debt Ramping Up Again: Net debt rose to ₹1,851 Cr from net cash in FY24—needs close alignment with EBITDA delivery.
Geopolitical/Export Dependency: 75–80% revenue from exports—vulnerable to global disruptions or regional policy shifts.
6.2 Man Industries – Guidance & Outlook for FY26 and Beyond
A. FY26: Revenue growth of 20% = Toning down growth expectations
A 20% topline growth in FY26 would translate to a projected revenue of ₹4,206.8 Cr for Man Industries.
All announced projects are progressing well and based on the current execution visibility, we are confident of achieving 20% growth topline during this fiscal.” — Q4 Earnings Call
Total revenue which we are expecting at the consolidated level for FY '26 is ₹5,500 crores. Q3 Earnings Call
B. EBITDA Growth of 25%
Man Industries has guided for an EBITDA margin of 10.4–10.9% in FY26. Assuming a conservative margin of 10.5% on projected revenue of ₹4,206.8 Cr, EBITDA could reach ₹441.7 Cr. This would mark a 25% increase over the FY25 EBITDA of ₹353.2 Cr, reflecting strong operating leverage.
“We anticipate a 50 to 100 basis improvement in EBITDA margins.”
C. Strong Outlook for Free Cash Flow == ~₹100 Cr per year
It will be expected in revenue and profit over the period of 5 to 6 years, every year around average Rs. 100 crores to Rs. 120 crores will be coming to our P&L. Monetizing will continue
D. FY25-28 Revenue CAGR of 32%
A 20% revenue growth in FY26, followed by another strong year, would put Man Industries on track to reach approximately ₹8,000 Cr in revenue by FY28 — implying a 32%+ CAGR over FY25–FY28.
Question: “So once it is at a very optimum or I would say at capacity utilization of 90%, you can do Rs. 8,000 at these topline level, right? Real estate revenue is separate.“
Answer: “So there will be two growth, one will be for year this one which we are aiming 20% conservative then another growth on top of that. Then I think so our estimation and whatever you are saying is going to match.”
E. EBITDA Margins Post-Ramp-Up = 12%
If EBITDA margins scale up to 12% post the ramp-up of the Saudi and Jammu projects, Man Industries could potentially deliver ~50% CAGR in bottom-line growth over FY25–FY28. While we acknowledge the 12% margin potential, our estimates currently factor in a more conservative 10.4% margin. These assumptions would be revised upward once the new capacities are fully operational and start contributing meaningfully.
'26-'27 will be the much better. Because once we stabilize everything, that is why very conservative side we are estimating same EBITDA of 12% as an overall average
7. Valuation Analysis
7.1 Valuation Snapshot
P/E (FY25 / FY26E) 15.45× / 9.8×
Current valuation is modest, pricing in only base-case execution.
Multiple re-rating likely if FY26 guidance is achieved.
EV/EBITDA (FY25 / FY26E) ~6.5× / 4.8× (based on ₹441.7 Cr EBITDA)
Attractive; suggests undervaluation relative to forward earnings power and free cash flow generation.
ROE / ROCE (FY25) 10.2% / 16.3%
Improving trend. ROCE rebound supports confidence in capital productivity post-capex.
Market Cap to Sales (FY25) ~0.65× (₹2,290 Cr / ₹3,505 Cr)
Rerating potential as revenue scales toward ₹6,000–₹8,000 Cr by FY27–28.
7.2 What’s in the Price?
FY26 Revenue of ₹4,200–₹4,500 Cr: Market seems to price in 20% topline growth, not the earlier ₹5,500 Cr guidance.
EBITDA Margin of 10–10.5%: Consensus is aligned with conservative margin guidance, factoring in moderate operating leverage.
Steady Export Order Book: 75–80% export contribution appears priced in, given historical execution and market relationships.
Merino Shelters Upfront Gain: ₹70 Cr cash and ₹368 Cr revenue already booked in FY25.
ERW Revenue Contribution (~₹350 Cr): Now established and being consistently factored into core business valuations.
Q4 FY25 Recovery: Operational rebound is acknowledged in the recent price uptick from the 52-week low.
7.3 What’s Not in the Price? (Potential Upside Triggers)
These upside drivers are not fully priced in and could lead to valuation rerating:
Ramp-Up of Saudi & Jammu Plants
Potential to add ₹2,500–3,000 Cr revenue at peak.
Full EBITDA contribution likely from FY27 onward at higher margins (12–25%).
Margin Expansion to 12%+
Management hinted at post-ramp-up EBITDA margin of 12%.
This implies ~₹1,000 Cr EBITDA potential on ₹8,000 Cr revenue (FY28 goal).
Merino Shelters Recurring Inflows
₹700 Cr over 5–6 years (~₹100–120 Cr per year) at near 100% EBITDA conversion.
High-quality, asset-light free cash flow not yet fully reflected.
Valuation Re-Rating on Execution
FY26E P/E ~9.8× and EV/EBITDA ~4.8× imply rerating headroom if earnings visibility improves.
Sector leaders trade at 15–20× P/E; Man could re-rate to ~12–15× as it scales.
Strong EPS CAGR of ~50% (FY25–28E)
With EPS expected to rise from ₹22.78 (FY25) to ₹50+ by FY28, PEG is <0.3× — compelling growth at low multiple.
Optionality from Green Hydrogen/Seamless Pipes/Import Substitution
SS seamless pipes from Jammu plant could tap strategic sectors (nuclear, defense, hydrogen).
8. Implications for Investors: What to Watch
8.1 Bull, Base & Bear Case Scenarios – Man Industries
Bull Case
All levers fire together, driving strong revenue scale-up, margin expansion, and valuation re-rating.
Revenue Growth: ₹8,000 Cr+ by FY28
Driven by full capacity utilization at Saudi & Jammu, strong exports, and stable core LSAW/ERW business.EBITDA Margin: 12–12.5%
Operating leverage kicks in; high-margin SS seamless pipes from Jammu scale smoothly.Exports: Contribute 80%+ of revenue
With enhanced order flow from MENA, Far East, and traction from Western geographies.Real Estate Monetization: ₹700 Cr realized over FY26–30
Asset-light recurring cash flows fully integrated into earnings.Capital Allocation:
Free cash flow from core + real estate funds expansion; low need for external debt; potential dividend initiation.
Base Case
Execution meets guidance, with some conservative assumptions on ramp-up timing and margins.
Revenue Growth: ₹6,000 Cr by FY28
New plants ramp by FY27; ERW and legacy exports continue steady growth.EBITDA Margin: 10.5–11%
Modest improvement over FY25, with efficiencies building up over time.Exports: 75–80% of revenue
Pipeline remains strong; diversified product and geography mix.Real Estate Monetization: ₹100 Cr+ per year over FY26–30
Smooth recognition in P&L, supports net cash position.Capital Allocation:
Capex funded via internal accruals and low-cost debt; working capital managed tightly.
Bear Case
Execution lags, new capacity faces commissioning delays or low utilization; real estate flows delayed.
Revenue Growth: ₹5,000 Cr or less by FY28
Ramp-up is slower than expected; order inflow from Saudi/MENA weakens.EBITDA Margin: 9.5–10%
High fixed costs from underutilized capacity weigh on profitability.Exports: Drop to ~65–70% of mix
Competitive pressure in key export markets or geopolitical headwinds.Real Estate Monetization: <₹400 Cr realized by FY28
Sales cycle slower than expected; cash flows lumpy.Capital Allocation:
Higher working capital strain; rising debt to fund capex; return ratios stagnate.
8.2 Key Risks & What to Monitor — Man Industries
A. Execution Risk – New Capacity Ramp-Up
FY26 is a transition year with Saudi & Jammu plants scheduled to go live in Q3. Any delay in commissioning or underutilization in FY26–27 could impact the revenue base and delay the 12% EBITDA margin trajectory.
Monitor: Project execution updates, Q3–Q4 utilization, export readiness, capacity absorption.
B. Margin Risk from Product Mix
New verticals like ERW and stainless seamless pipes have differentiated margin profiles. A slower ramp in SS or pricing pressure in ERW exports could cap EBITDA below 10.5%.
Monitor: Segment mix commentary, order quality, pipe pricing vs. raw material trends, fixed-cost leverage.
C. Order Book & Export Visibility
Sustaining growth depends on timely export conversion, especially in MENA, Far East, and Europe. Real estate monetization is also critical to cash flow targets.
Monitor: Order intake disclosures, export vs. domestic mix, Merino inflow tracking, bid pipeline conversion.
D. Working Capital & Cash Flow Risk
Inventory spiked in FY25, and receivables remain high. With multiple projects running, any delay in cash realization can pressure ROCE and net debt.
Monitor: Receivable days, inventory turnover, net working capital trends, Merino cash visibility.
E. Valuation Sensitivity
At ~9.8× FY26E P/E, stock reflects EPS of ₹35+. Any slippage in margin, real estate cash flow, or project execution may compress valuation multiples.
Monitor: Quarterly EPS vs. expectations, commentary on margin trajectory, rating outlook from brokers.
F. Geopolitical / Trade Risk
With 75–80% revenue from exports, global disruptions (e.g., Red Sea, US tariffs, Middle East tensions) can affect order flows or shipment timelines.
Monitor: MENA order health, shipping costs, new sanctions/tariff regimes, macro commentary from EU and Gulf markets.
9. Margin of Safety for a Man Industries Investor
A. Valuation Embeds Conservative Growth, Leaving Room for Upside
At ~9.8× FY26E P/E and ~4.8× EV/EBITDA, Man Industries trades well below mid-cap industrial peers. Current valuation assumes:
Revenue grows 20% in FY26 and reaches ~₹6,000–₹6,500 Cr by FY28
EBITDA margins remain in the 10.4–10.9% range, not the guided post-ramp-up 12%
Merino Shelters contributes ~₹100 Cr per year without valuation uplift
Saudi & Jammu plants commercialize gradually with measured ramp-up
➡️ This leaves ample room for re-rating if Man delivers even moderately above expectations. Execution risks exist, but valuation does not price in full potential, offering a buffer.
B. Ramp-Up Projects Are Core to the Growth Thesis
The Saudi and Jammu plants are critical to doubling revenue and improving blended margins.
Both are expected to contribute ₹2,500–3,000 Cr at peak utilization
Stainless seamless (Jammu) is high-margin (20–25%) but yet to scale
Merino monetization is cash-accretive, but spread over 5–6 years
ERW expansion is progressing but still under 15% of revenue
These initiatives are execution-dependent and form the core of the FY27–FY28 growth runway. Delays or underutilization could push out earnings inflection.
C. What’s Supporting the Downside?
Even if ramp-up is slower than planned, Man Industries is supported by:
Undemanding valuation: P/E <10× on FY26E earnings; PEG <0.3× on ~50% EPS CAGR
Recurring FCF from Merino Shelters: ₹700 Cr inflow over 5–6 years with no capex or opex
Export-heavy order book (75–80%): Diversified across MENA, Far East, and Europe
No equity dilution: Growth funded through internal accruals + modest debt
These factors won’t prevent volatility, but do mitigate risk of permanent capital erosion.
9.1 Overall Margin of Safety: Moderate to High
Man Industries offers moderate-to-high margin of safety for long-term investors. The current valuation:
Prices in only the base case — not full benefit of capacity, margin, or cash flow ramp-up
Offers optional upside from stainless exports, high-margin orders, and real estate FCF
Is suitable for investors with a 2–3 year horizon looking for value + earnings visibility
While short-term risks exist around ramp-up and working capital, the company’s capital efficiency, diversified revenue base, and undervaluation provide a compelling long-term case.
Don’t like what you are reading? Will do better.` Let us know at hi@moneymuscle.in
Don’t miss reading our Disclaimer