
Kaynes Technology FY25 Results: PAT up 60%, Eyes 60% Revenue growth in FY26
Targeting $1B by FY28 & $2B by FY30, strong growth fully priced in; leaving no margin for error. Limited upside remains unless margins or scale beat expectations
1. Electronic System & Design Manufacturer (ESDM)
kaynestechnology.co.in | NSE: KAYNES

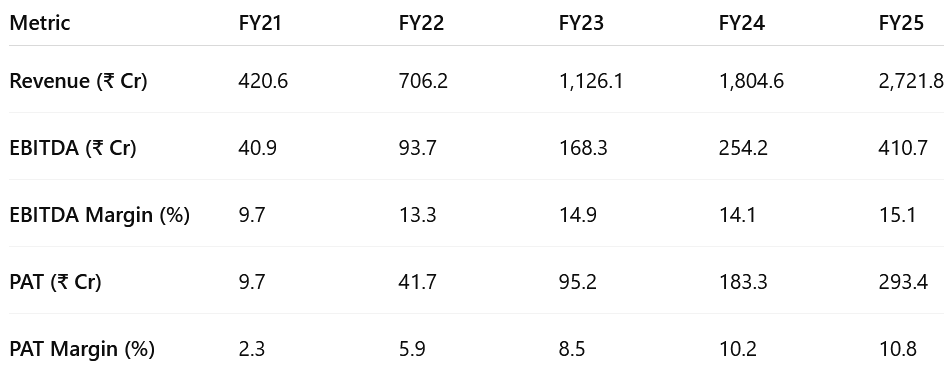
2. FY21-25: PAT CAGR 135% & Revenue CAGR 59%
2.1 What Changed Between FY21–25
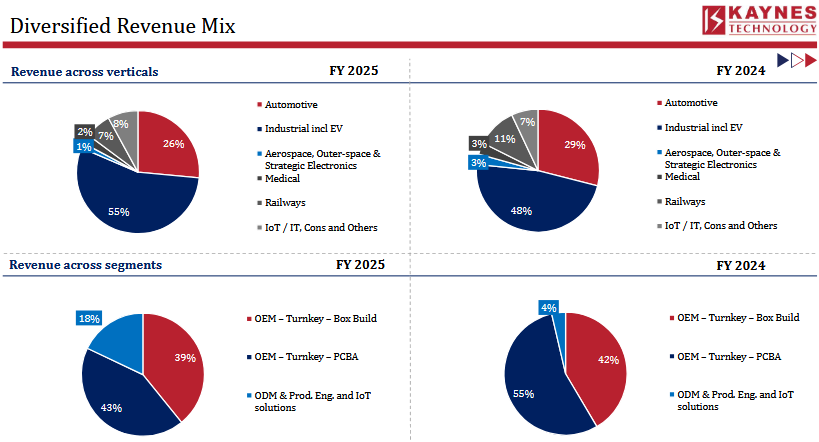
Revenue Mix: Richer mix = fatter gross margins, less low-margin assembly
Scale & Geography Revenue: Confirms export traction and vertical diversification
Profitability; Mix + leverage trump start-up costs
Order Backlog Book: Locks in growth to FY-27; backs >55% FY-26 guide
Capex: OSAT (Sanand) & HDI-PCB (Chennai) launched; Phase-II Chamarajanagar; smart-meter line ramped. Opens high-margin semi/PCB verticals, adds capacity
M&A / Platforms: Added Sensonic, Iskraemeco; integrated August Electronics. Brings IP and offshore footprint; boosts customer stickiness
Big Picture: In four years Kaynes morphed from a domestic EMS assembler into a solutions-led, globally exposed electronics platform with double-digit margins and a semiconductor runway for its next growth phase.
3. Q4-25: PAT up 43% & Revenue up 54%
PAT up 75 % QoQ & Revenue up 49 % QoQ
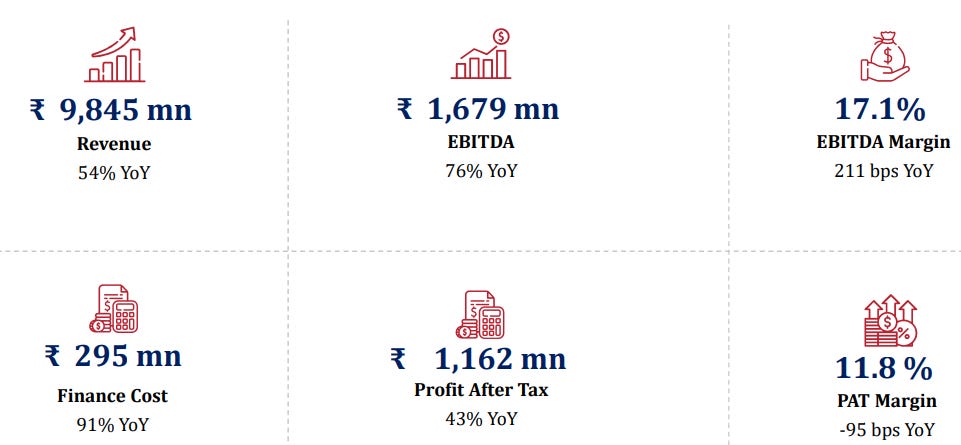
Revenue surged as auto, industrial, and aerospace verticals ramped.
EBITDA margin jumped led by ODM mix and scale benefits.
PAT — highest ever quarterly profit.
Export traction improved, aided by Canada subsidiary (August Electronics) and Sensonic consolidation.
Working capital stretched slightly, but topline and margin expansion drove strong operating leverage.
4. FY-25: PAT up 60% & Revenue up 51%

Revenue — driven by smart meters, industrial/EV orders, and deeper wallet share.
PAT margin — crossed 10% for the first time.
ODM + IoT contribution hit 18% of revenue, up from <2% in FY24 — driving mix enrichment.
Order book expanded 60% YoY to ₹6,597 Cr, securing visibility through FY27.
Net cash providing capital headroom ahead of OSAT/HDI-PCB ramp.
Smart meter revenue doubled to ₹500 Cr+, positioning Kaynes as a leading domestic device supplier.
5. Business Metrics: Muted Return Ratios
Temporarily Muted by Front-Loaded Capital Infusion
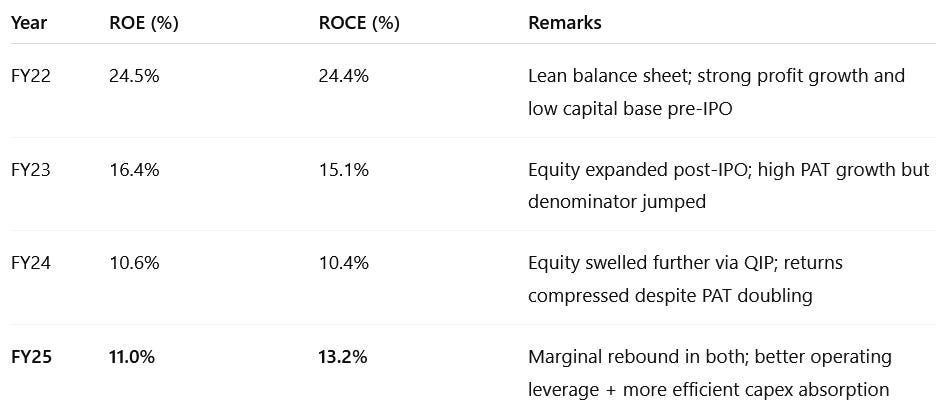
After peaking above 24 %, Kaynes’ ROE/ROCE have temporarily cooled to ~19 % as it front-loads capacity for the next growth leg. With capex past its heaviest phase and richer product lines coming onstream, a rebound toward the low-20s looks achievable by FY27.
6. Outlook: 60% Growth in FY26 with 50 bps margin expansion
6.1 FY-25 Expectations vs Performance — Kaynes Technology
✅ HITS (Met / Beat Guidance)
Margin Expansion. EBITDA margin improved +101 bp to 15.1 %, above the 15% guided earlier.
Richer Mix. ODM + IoT share went up to 18 % of revenue, lifting gross profitability.
Order-book Surge. Backlog climbed +60 % to ₹ 65,969 Cr (≈2.4× sales), securing growth visibility through FY-27.
Strategic Capex on Track. OSAT (Sanand) and HDI-PCB (Chennai) projects progressed on schedule; first revenue expected Q4 FY-26.
Export Traction. North-American contribution rose to 5 % after the August Electronics acquisition, supporting diversification.
❌ MISSES (Below / Deferred vs Guidance)
Revenue Growth: 51 % YoY looks strong, but was weaker than the initial guidance of ₹3,000 Cr which was subsequently trimmed down to ₹2,800-2,900 Cr .
Return Ratios Dip. ROE slid to 19.4 % and ROCE to 19.2 % (from 22–24 %) as heavy capex inflated the asset base faster than earnings.
Working-Capital Creep. Net-WC days rose to 87 (target < 80) due to inventory builds for new programmes; management aims to reverse this in FY-26.
Negative Operating Cash-Flow. OCF turned -₹ 823 Cr, pressured by inventory and receivable spikes despite robust EBITDA.
Finance-Cost Drag. Higher borrowings for capacity expansion trimmed PAT margin ~70 bp YoY, masking part of underlying operating leverage.
6.2 Guidance FY26 & Beyond — Kaynes
FY-26: 60% growth with 50 bps margin expansion
FY-28: $1 billion revenue
FY-30: $2 billion revenue
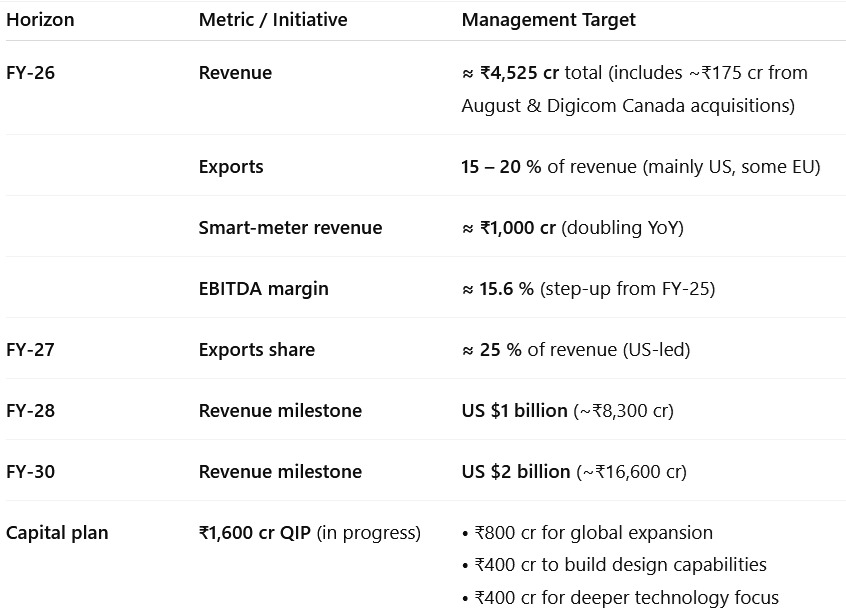
Revenue: minimum 60% growth will be there in operating revenues.
Margins: we also expect about 50 basis points expansion in our EBITDA numbers.
Order Book: Order book surged from INR41,152 million at the end of Q4 of FY '24 to INR65,969 million at the end of Q4 FY '25.
This order book will get executed over 1.5-year time frame
So the order inflow to tell you honestly, is very, very healthy.
Most of the orders that come in are at a margin accretive kind of situation.
Strategic moves:
Continue bolt-on overseas acquisitions to widen US presence.
Promoter stake sale (1.8 %) funds “Kaynes Centre” educational/research project in Mysuru—no further stake sales planned this year.
Demand outlook: Management sees low demand-side risk, citing resilient global electronics flows and India’s improving trade position.
Customer specifics
Smart-meters a key growth engine
Ola Electric contribution to dip in FY-26 but not material to guidance.
7. Valuation Analysis — Kaynes
7.1 Valuation Snapshot
Headline Valuation
Triple-digit trailing P/E (124×) & EV/EBITDA (87×) place Kaynes at the very top of India’s electronics/EMS peer band.
The stock is pricing in sustained hyper-growth and no margin slippage.
Forward Convergence
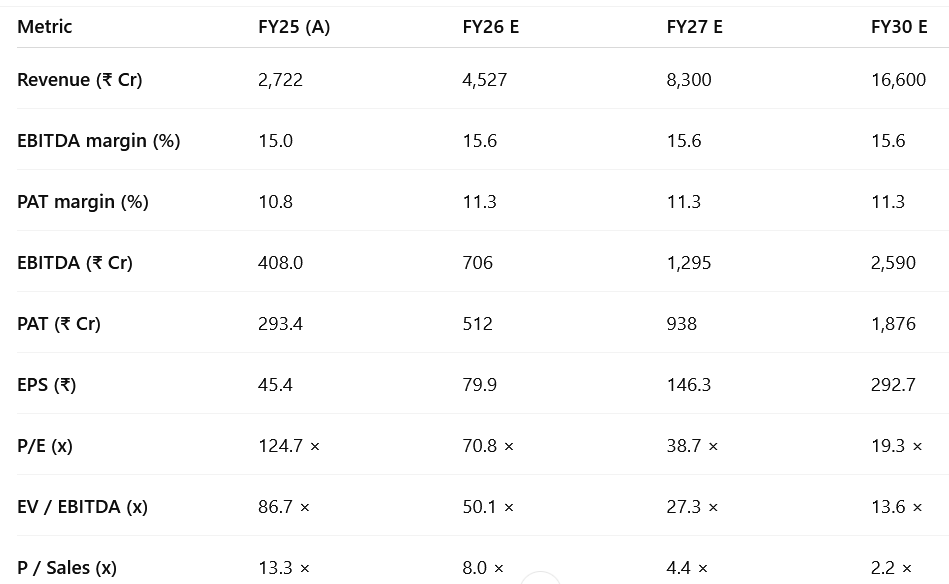
On FY-27 numbers the multiples compress to 39× P/E / 27× EV/EBITDA; by FY-30 they halve again to 20× / 14×.
Much of the “de-rating” simply stems from the denominator exploding; market is already discounting management’s $1 bn (FY-28) & $2 bn (FY-30) sales ambitions.
PEG Perspective
EPS CAGR FY-25→27 ≈ 78 % vs current P/E 124× → PEG ≈ 1.6.
Still a premium to the notional “fair-value” PEG of 1.0; growth is largely in the price.
7.2 What’s in the Price?
Valuation Reflects Strength: Market is assuming rapid scale-up with no execution slips.
Growth Targets Embedded: ₹8,300 Cr revenue and ~₹938 Cr PAT by FY27 already baked in (EPS ~₹145). $1 bn revenue by FY28 is considered base case.
Capex Fully Funded: QIP of ₹1,600 Cr priced in at ~5–10% discount; dilution impact (~5%) is absorbed in consensus forecasts.
Mix Shift Priced: ODM + IoT mix rising to ~25% by FY27, export share to 25%; semiconductor (OSAT/HDI-PCB) kicker from FY27 assumed in margins.
Capital Discipline Expected: ROCE rebound to 20%+ and net working capital days improving to sub-80 levels from FY26 onward.
Client Execution Assumed: Ramp-up from state utilities, smart-meter wins, and design-led exports from US/EU expected to deliver without delays.
7.3 What’s Not in the Price?
Faster OSAT Scale-Up: Revenue from OSAT (semiconductor packaging) and HDI-PCB lines may exceed FY27 targets if H2 FY26 ramp is smooth — EBITDA margin may expand >17%.
Export Surprise: Export share >30% by FY27 (vs guided 25%) from new US/EU wins could lift topline and margins.
QIP Re-Investment Multiplier: QIP proceeds may generate returns ahead of expectations through accretive acquisitions or faster design/IP monetization.
Design/IP Licensing Optionality: ODM/IP licensing potential is not reflected in current multiples — monetization could trigger structural re-rating.
Smart Meter Upside: State AMISP wins + GML onboarding may push FY26 smart-meter revenue >₹1,200 Cr vs ₹1,000 Cr guidance.
PLI Upside / Incentives: Subsidy-backed capacity expansion in OSAT or electronics assembly may ease capex drag and boost ROCE.
7.4 Risks and What to Monitor – Kaynes Technology
❗ Key Risks
Execution Risk: On-time ramp-up of OSAT and HDI-PCB capacity (targeted for Q4 FY26) is critical. Delays could compress FY27 growth and margin visibility.
Dilution Risk: If QIP pricing is materially lower, or further dilution occurs, FY26–27 EPS could miss expectations.
Working Capital Pressure: FY25 NWC days at 87 vs target of <80 — smart-meter receivables or export payment cycles slipping could affect cash flows.
ROE/ROCE Compression: If topline lags capex absorption, return ratios may stay <20% longer than expected — especially if semiconductor ramp lags.
Export Exposure Risk: US + EU customer concentration grows, any macro disruption or trade policy shift could delay orders or impair realizations.
Client Concentration: Smart meter + EV OEMs + a few large US clients form a major part of pipeline — dependency could pose forecasting risks.
👀 What to Monitor
GML Share: Targeting 60% of smart meter volumes through Govt-led onboarding — success here drives revenue and working capital normalization.
OSAT/HDI Ramp Timelines: Construction, equipment commissioning, and qualification progress for both new verticals (esp. Sanand, Chennai).
QIP Pricing and Utilization: Actual raise price, dilution, and asset deployment efficiency.
Inventory & Receivables Turns: Ability to reduce inventory-to-sales and receivable cycles critical to unlocking OCF.
Export Client Wins: Any large anchor wins in US/EU beyond current pipeline to raise visibility into FY27–28 goals.
8. Implications for Investors
8.1 Bull, Base & Bear-Case Scenarios — Kaynes
Bull Case
Revenue > ₹9,000 Cr by FY27
OSAT and HDI-PCB ramp by Q3 FY26 with >20% segment margins
Smart meter revenue > ₹1,300 Cr in FY26
Export share crosses 30%
PAT margin >12%
no dilution drag from QIP
Probability = Low – Requires early and flawless execution across all verticals with strong export tailwinds
Base Case
Revenue meets ₹8,300 Cr by FY27 as guided
OSAT/HDI ramp from Q4 FY26
EBITDA margin steady at ~15.6%, PAT margin 11.3%
Export share reaches 25%
Smart meter revenue around ₹1,000 Cr
QIP funds deployed efficiently; return ratios normalize >20%
Probability = High – In line with company guidance, order book, and execution track record
Bear Case
Revenue misses targets, ends < ₹7,500 Cr by FY27
OSAT/HDI face commissioning delays or yield issues
Smart meters < ₹800 Cr
Export share stagnates <20%
Margins compress below 14%;
PAT margin <10%
ROE fails to expand beyond 15%
Probability = Moderate – A few execution delays or margin pressures can derail projections and trigger valuation compression
8.2 Is There Any Margin of Safety?
Revenue Growth: ₹8,300 Cr by FY27 and ₹16,600 Cr by FY30
❌ Fully priced – 2× every 3 years
Margins: 15.6% EBITDA, 11.3% PAT assumed through FY30
❌ No buffer for ramp delays in OSAT, HDI-PCB
Valuation Multiples
❌ Rich — No buffer, valuation bakes in perfect growth + margin delivery
Execution Risk
❌ High-stakes — any slip in smart meter ramp, export order timing, or capex efficiency can cause derating
Re-rating Potential
❌ Limited — FY30 P/E already falls to ~19× if all goes well; little upside beyond execution
Return Ratios
❌ Not supporting premium yet — ROE/ROCE still < 13%; must cross 20%+ to justify valuation
Balance Sheet Strength
✅ Some cushion — Net cash of ₹900+ Cr provides financial safety, but doesn't offset valuation stretch
Peer Comparison
❌ Premium vs Indian and global EMS players — no room for multiple expansion
👉 Bottom Line
Kaynes offers compounding — not comfort.
It is a “priced-for-perfection” compounder.
Margin of safety = Minimal. Every investor must ask: Do I trust flawless execution through FY30?
Don’t like what you are reading? Will do better. Let us know at hi@moneymuscle.in
Don’t miss reading our Disclaimer