
Jindal Saw: 30%+ revenue growth & 100%+ EBITDA growth in FY24 at a PE of 12
JINDALSAW is a direct beneficiary of Govt. and Private sector investments in infrastructure creation and is confident that its well poised for the next 15-18 months
1. Manufacturer of Iron & Steel pipe products
jindalsaw.com | NSE : JINDALSAW
Business Segments
Saw Pipe: Manufacturing LSAW & HSAW pipes in 6 pipe mills in India
DI Pipes & Pig Iron: 3rd largest producer of DI Pipes globally with plants in India & Abu Dhabi (UAE).
Seamless Pipes
Carbon & alloy steel pipes & stainless steel (including stainless seamless pipes & Tubes and stainless welded pipes & tubes)
Entered in a JV with Hunting Energy Pte. Ltd (49%) to set up precision machine shop for premium connections. JV to start production in next financial year i.e. 2024.
Iron Ore Mines and Pellet: Low grade iron ore mine with iron ore beneficiation & pellet plant at the mine head
~ 50% of the JINDALSAW revenues come from the water supply and sanitation (WSS) which is growing rapidly in India and globally. Oil & Gas sector accounts for only one third of the total revenue
2. FY21-23: Growth after a bottom in FY21
From a peak revenue of Rs 12,000+ crore in FY19, revenue fell to sub Rs 10,872 cr in FY21 before getting on a growth trajectory.
Revenue = 29% CAGR FY21-23
PAT = 16% CAGR FY21-23

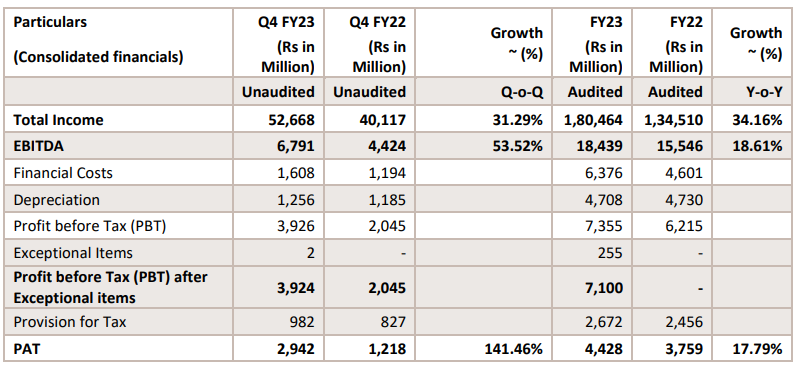
3. FY23: PAT up 18% and Revenue up 34% YoY
Top line is Rs. 18,000 crores. Rs. 1,844 crores is your EBITDA. A PBT of Rs. 736 crores. As we have been saying, the subsidiaries have also started contributing.
4. Q1-24: Revenue up 27% YoY and in profit from losses
In Q1 FY24, the Company has witnessed growth in volumes as well as favorable business mix resulting into improved turnover and margins on YoY basis. Raw material prices have stabilized, and execution levels have improved. Consistent order book position over and above US$ 1.4 billion, indicating improved conversion rate of enquiries into confirmed orders.

5. Business metrics: Return ratios are not expectational but lot of free cash flow to be expected
We are carrying out modernization, but there is no major projects that has been announced on the horizon. So we expect the capex -- so, if you see the way the cash flows, there would be a lot of free cash flow is what we are expecting to come out of the would be largely used to pay for capex, pay for loan, use it for shareholder distribution. And also, we expect working capital reduction.

Free cash flow in FY23 = Net cash inflow / (outflow) from operating activities + Purchase of property, plant and equipment and intangible assets
Free cash flow in FY23 = 1,61,742.38 + (32,249.65) ==> Rs 1294.927 cr
Rs 1295 cr of free cash flow in FY23 on a market cap of Rs 11,083 cr implies a free cash flow yield of 11.7% which makes the stock quite attractive.
6. Outlook: 30+% revenue growth in FY24
i. FY23 momentum to continue: 30%+ top-line growth in FY24
I have already given you a guidance that '22 compared to '23, we are expecting a similar trend in '24.
ii. 100%+ EBIDA growth in FY24: 16% FY24 EBITDA vs 10% in FY23
A 30%+ growth in revenue and 16% EBITDA margin
FY24 EBITDA = 130% X FY23 Revenue X 16% EBITDA Margin
FY24 EBITDA = 130% X 18,046 X 16% = Rs 3,754 (vs Rs 1,844 cr in FY23)
FY24 EBITDA growth = 100%+
So, based on how many shipments we are able to capture in one quarter and if there is any last spill over, there could be a slight fluctuation, but the indication, the trend of the EBITDA staying in and around 16 shall remain
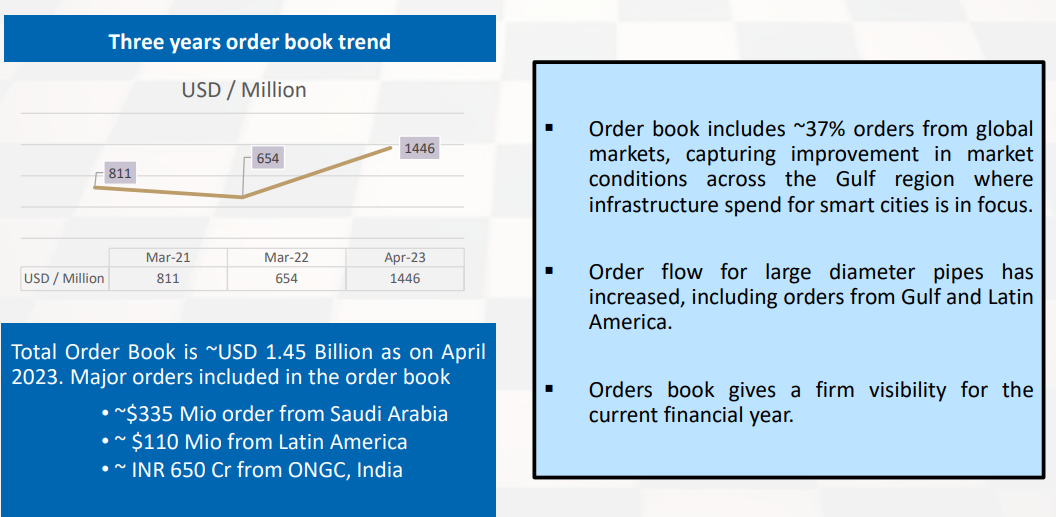
iii. Strong revenue visibility: Order-book 0.64X FY23 revenue
Q1-24: The current order book for Iron & Steel pipes and pellets is ~US$ 1.40 billion, the break-up is as under:
Iron & Steel Pipes: US$ 1,391 million
Pellet: US$ 7 million
The order book includes ~34% orders from global markets, which reflects improvement in market conditions across the globe primarily in Gulf region where infrastructure spending for smart cities is in focus.
These shall be executed over a period of 12-18 months.
iv. CAPEX not required to support growth in till FY25
So, we are nowhere close to the peak. We still have a few paces to go before probably we would require a new cycle of CAPEX or capacity expansion or mergers and acquisitions. Before we get into that, that's a stepped function. We still have enough available potential to go a few steps more.
7. 30%+ revenue growth and 100%+ EBITDA growth in FY24 at a PE of 12

8. So Wait and Watch
If I hold the stock then one may continue holding on to JINDALSAW . The business is on a growth trajectory since FY21 and the management expects the momentum to carry on for another 18 months.
The place where we are looking at, we think and we have a lot of confidence with a high level of probability that we can see about 15 to 18 months of very good performance.
The top-line guidance, PAT expectations and order book visibility give reasons to stay in the stock.
One needs to watch for the JINDALSAW subsidiaries contribution to the business. It can add to the upside available in the stock.
As we have been saying, the subsidiaries have also started contributing. For the current year, we expect to do far better, even may exceed the year before’ s performance for Abu Dhabi. Similar is the case for the US.
One needs to look out for the industry tail-winds continuing. JINDALSAW is direct beneficiary of Govt. and Private sector investments in infrastructure creation. As long as the momentum in infrastructure creation continues, there is a case of staying invested with JINDALSAW .


9. Or, join the ride
If I am looking to enter the stock then
JINDALSAW is guiding for 30%+ growth, in line with the top-line growth achieved in FY22. The growth will come without additional capex while improving margins. JINDALSAW at a PE of 12 for 30%+ top-line growth makes valuations quite attractive.
JINDALSAW is generated Rs 1,295 cr of free cash flow on market cap of Rs 11,083 cr. JINDALSAW is available at free cash flow yield of 11.7% which makes valuations look very attractive. JINDALSAW is indicating that a lot of free cash flow is expected
There would be a lot of free cash flow is what we are expecting to come out of the would be largely used to pay for capex, pay for loan, use it for shareholder distribution. And also, we expect working capital reduction.
JINDALSAW at a market cap of about Rs 11,083 cr against a FY23 sales of Rs 18,046 cr means that is available a market cap to sales of 0.6
If JINDALSAW is likely to scale a new peak in Q4-24, then can the stock also make a new peak in anticipation if the Q4-24 peak?
Jindal Saw traditionally has always shown a cyclical nature, where Q1, Q2 is usually subdued, Q4 is the peak. So therefore, by the indication that we are getting in our Q1, it appears that this time also, as we did last time, Q4, we are likely to scale a new peak.
Don’t like what you are reading?
Let us know at hi@moneymuscle.in
Will make it better.
Disclaimer
It is an analysis of the company data and not a stock recommendation
My analysis can be completely wrong and can change the next minute based on changes in my understanding of the company
I look to own good companies at prices where there is a path to market beating returns over decades