
ITD Cementation Q1 FY26 Results: PAT up 37%, FY26 Guidance for 20-25% Growth
Robust order book, stable margins, strong execution, ADANI synergies position ITD for sustained growth. Premium valuations assume continuity in growth and delivery
1. EPC player undertaking Heavy Civil & Infrastructure projects
itdcem.co.in | NSE : ITDCEM
One of the leading Engineering and Construction Companies undertaking Heavy Civil, Infrastructure and EPC business
Expertise in Maritime Structures, Mass Rapid Transit Systems, Airports, Hydro-Electric Power, Tunnels, Dams & Irrigation, Highways, Bridges & Flyovers, Industrial Structures and Buildings, Foundation & Specialist Engineering

2. FY21-25: PAT CAGR of 111% & Revenue CAGR of 35%
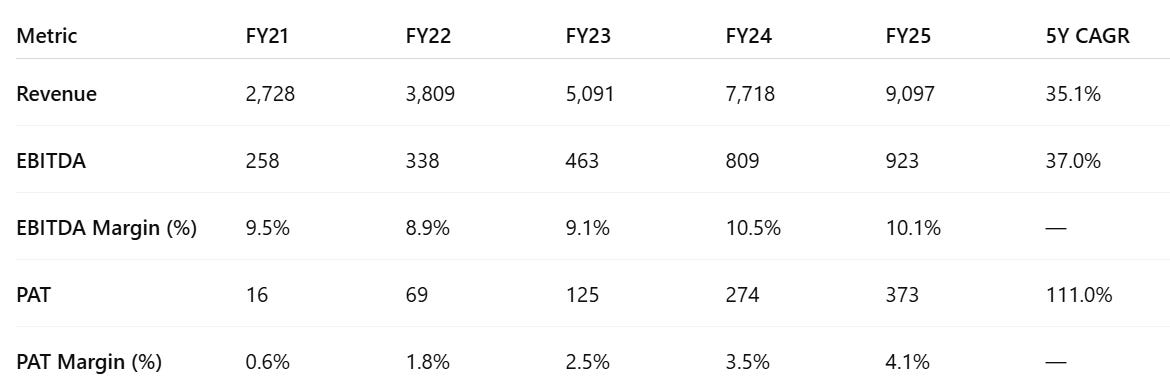
Revenue and EBITDA growth, reflecting strong project execution and scale benefits.
Steady EBITDA margin expansion and rising PAT margin highlight disciplined cost control and better project mix.
3. FY-25: PAT up 36% & Revenue up 18%
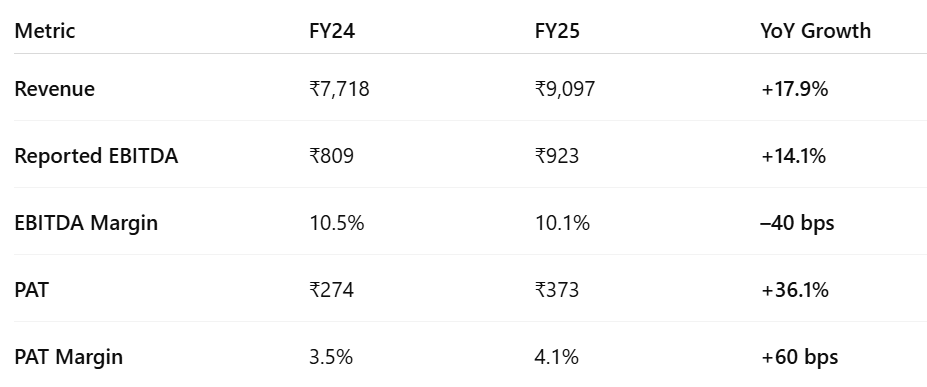
Execution matches management tone: Revenue growth was just shy of 18%, well within the ±20% guidance band — reflecting realistic forecasting and effective execution.
Management comment on FY25 & FY26 growth during Q3-25 call: '25, '26 you can find, as I have mentioned before also, around 20% plus-minus we should be.
Margins held firm: Despite input cost pressures across the sector, EBITDA margin was steady at 10.1%, aligning with the guided stability.
Bottom-line outperformance: PAT grew faster than revenue and EBITDA, indicating improving efficiency, lower finance or tax cost, or better working capital management.
4. Q1-26: PAT up 37% & Revenue up 7% YoY
PAT up 20% & Revenue up 2% QoQ
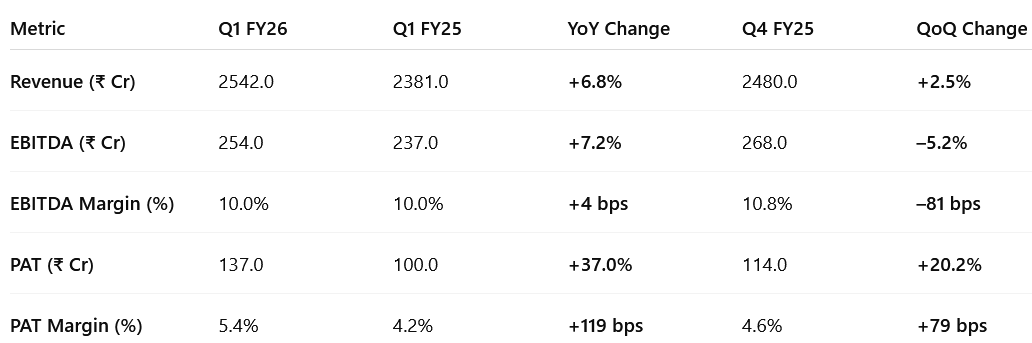
ITD Cementation has delivered a solid Q1 FY26 across revenue, profitability, and order wins.
Moderate revenue growth (~7% YoY) reflects execution discipline despite a high base.
PAT grew 37% YoY, significantly ahead of revenue growth due to improved cost control and execution efficiency.
Margins remained stable YoY and healthy in context of sector headwinds.
Airports and marine will be key drivers, including international expansion (Abu Dhabi LNG jetty win validates global credibility).
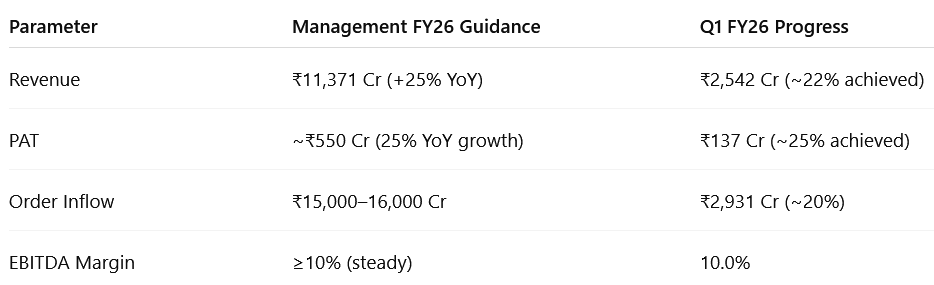
Order inflow in Q1 FY26: ₹2,931 Cr ~19-20% of FY26 target (₹15,000–16,000 Cr).
Order book as of June 2025: ₹18,820 Cr (up from ₹18,300 Cr in Mar 2025)
Book-to-Bill Ratio (based on FY26E revenue): 1.65× (20 months of revenue visibility)
Execution in Bangladesh project is on track — management expects ~₹1,500 Cr revenue from it in FY26.
Outlook – Well Aligned with FY26 Guidance
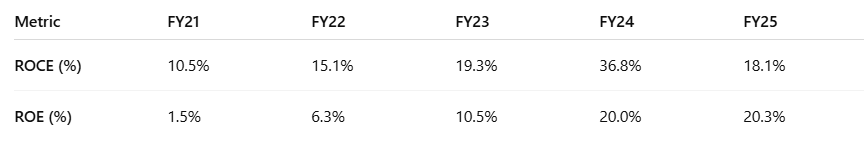
5. Business metrics: Steady return ratios
6. Outlook: 20-25% Revenue Growth in FY26
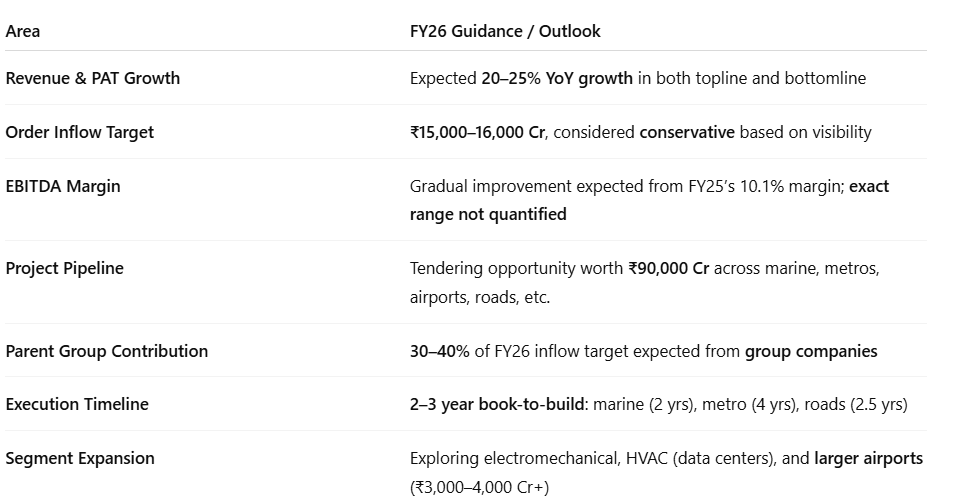
Topline Growth
Expecting ~25% YoY growth in revenue (vs. ₹9,097 Cr in FY25)
Bottomline Growth
PAT expected to grow in line with revenue, maintaining 25% growth momentum
EBITDA Margins
FY25 margin: 10.1%
Expecting gradual improvement in FY26
No specific margin target quantified
Order Inflow Target
₹15,000–16,000 Cr of new orders targeted
Described as conservative, backed by robust pipeline
Parent Group Contribution
30–40% of inflow expected from Adani group companies
Pipeline includes hydel and airport EPC jobs
Project Pipeline Visibility
₹90,000 Cr+ tendering pipeline across:
Marine, airports, underground metros
Tunnels, bridges, buildings, industrial structures
Specific Tender Opportunities
Vadhavan Port: ₹1,500 Cr (dredging + breakwater)
Airports: ₹15,000–20,000 Cr potential; Navi Mumbai Airport Phase 2 (₹4,000–6,000 Cr)
New Geographies
Exploring Middle East market (e.g., Abu Dhabi branch opened)
New Segment Expansion
Plans to enter electromechanical, HVAC for data centers
Enhancing capability for larger airport EPC projects (₹3,000–4,000+ Cr)
Execution Timelines (Book-to-Build)
Marine: ~2 years
Underground Metro: ~4 years
Roads: ~2–2.5 years
Overall: 2–4 year execution cycle
Order Backlog
₹18,300 Cr as of March 2025
No slow-moving orders reported
7. Valuation Analysis
7.1 Valuation Snapshot — ITD Cementation India
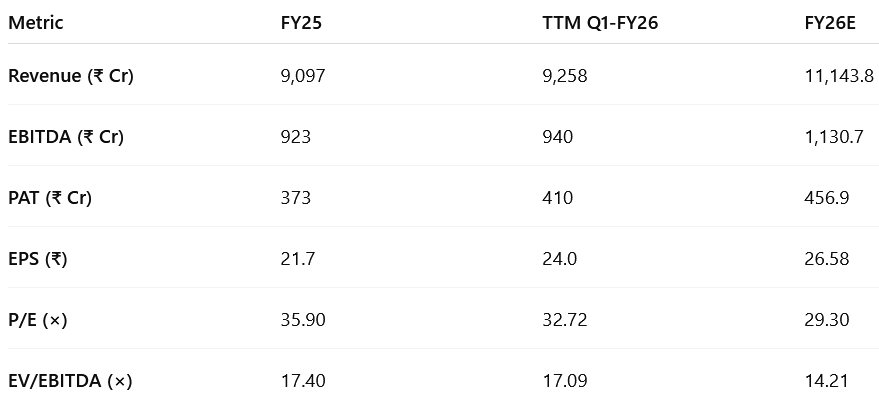
Mid-point of 20-25% growth guidance used for FY26E with stable margins
EV used: ₹16,063.5 Cr (as calculated using FY25 balance sheet + ₹13,382 Cr market cap)
Price-to-Earnings (P/E) Ratio
ITD is trading at a premium to most EPC peers, reflecting:
Consistent execution
Strong order book visibility
Long-cycle infrastructure projects offering revenue stability
However, the valuation implies FY27+ growth expectations are priced in, leaving limited room for disappointment.
EV/EBITDA Multiple
This multiple is still rich compared to sectoral peers:
Implied View: Market is pricing in:
Margin stability (10–11%)
Adani-sourced projects improving order inflows without hurting profitability
Continued low net debt levels
Valuation Ratios vs Growth:
P/E of ~29× vs PAT growth of ~23% implies a PEG ratio >1.2 → Not cheap
EV/EBITDA of 14.2× vs EBITDA growth of ~22% → Implies long-term margin sustainability is priced in
Valuation Risk Factors
High absolute multiples vs peers → vulnerable to re-rating if growth stalls
~37% of Q1 PAT growth came from margin tailwinds — needs to sustain
FY26 assumes ~₹15,000–16,000 Cr of fresh orders — any shortfall can dampen growth visibility
Supporting Valuation Drivers
Order book of ₹18,820 Cr → 1.65× book-to-bill (FY26E revenue)
Margin visibility supported by marine, airports, and Adani-led infra
Strong PAT delivery: Q1 FY26 PAT up 37% YoY
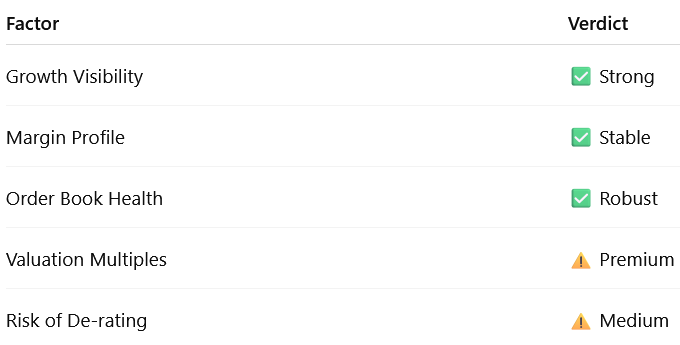
ITD Cementation is priced at a premium for its execution, order book quality, and Adani group tailwinds.
Further rerating depends on FY26 order inflow momentum and margin resilience in large-format projects.
7.2 Opportunity at Current Valuation
Multi-year revenue visibility with an ₹18,820 Cr order book and robust pipeline (~₹90,000 Cr); strong presence in marine, metro, and airport EPC.
Execution-led profitability — PAT up 37% YoY in Q1 FY26; PAT margin improved 119 bps YoY to 5.4%, reflecting operating leverage and disciplined project delivery.
Diversification benefits kicking in — shift away from pure public infra to include high-margin segments like airports, overseas marine (Abu Dhabi), and buildings.
Strategic backing from Adani Group — ~30–40% of FY26 order inflow likely from group entities; access to complex, large-format projects with operational synergies.
Valuation has started moderating — FY26E P/E at ~29× and EV/EBITDA at ~14.2×, down from ~35× and ~17× on FY25 basis.
Working capital under control — PAT to OCF conversion improving; net debt to equity remains under 0.55× despite ramp-up in execution.
Optionality from international markets (Middle East) and urban infrastructure (data centers, large terminals) could unlock new growth vectors.
7.3 Risk at Current Valuation
Valuation still rich — EV/EBITDA >14× and P/E nearing 30× (FY26E) leave little buffer for cost overruns or order inflow slippage.
Execution dependency — ₹1,000+ Cr quarterly execution pace needs sustained labor, materials, and site mobilization; slippage in 1–2 key projects can impact bottom line.
Adani group dependence rising — While strategic, over-indexing on one sponsor group could concentrate order risk and pricing power.
Limited cash conversion — Though improving, FY25 FCF yield was weak due to high reinvestment and margin-linked cash locks (retentions, advances).
Competitive intensity in metros and airports may squeeze margin if bidding discipline weakens in pursuit of growth.
Tender delays or regulatory bottlenecks in large marine and PSP projects (especially those with government or multi-agency clearance) may affect inflow visibility.
Risk Rating: MODERATE-HIGH
Current valuations assume continuity in PAT growth and margin delivery. Any delay in high-value Adani or overseas projects, or cost overruns in complex urban infra, could lead to earnings disappointment and valuation compression.
Previous coverage on ITDCEM

Don’t like what you are reading? Will do better. Let us know at hi@moneymuscle.in
Don’t miss reading our Disclaimer