
ICICI Prudential Life Insurance FY26: Valuation Analysis
P/EV at 1.5x, P/VNB at 31x, falling RoEV, weak APE growth, and rising protection mix. ICICI Prudential Life looks inexpensive. Is the market’s caution justified?
ICICI Prudential Life is a private life insurer offering long-term savings and protection products
iciciprulife.com | NSE: ICICIPRULI
1. Key Reported Metrics
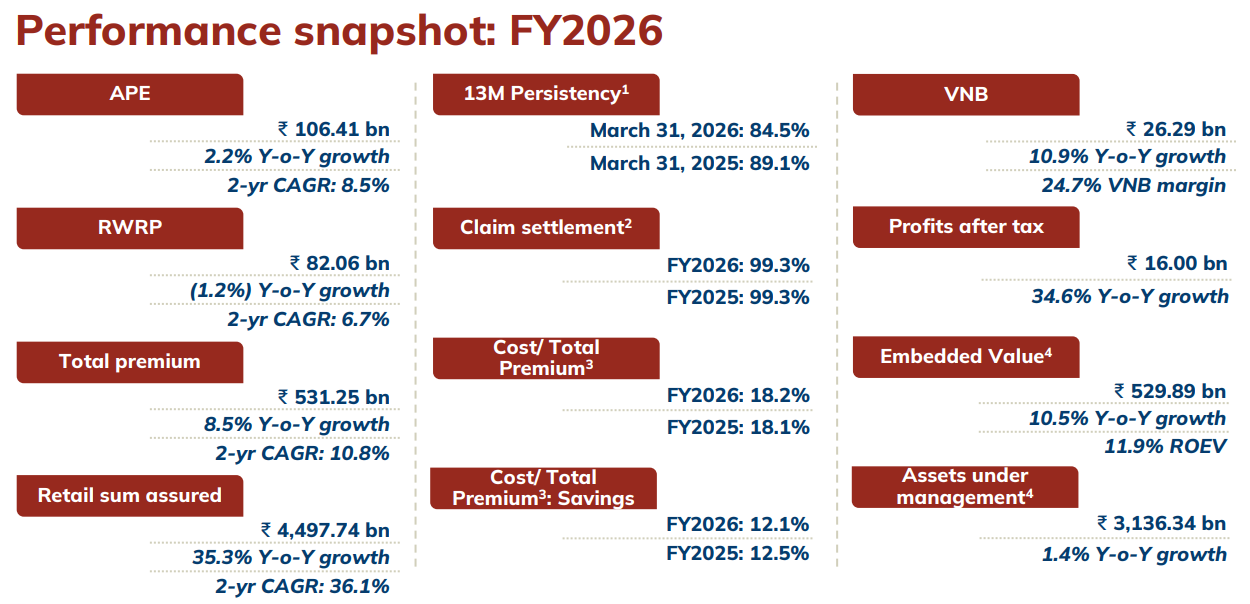
2. Valuation Multiples
Price-to-Embedded Value (P/EV) — the primary metric
EV = ₹52,989 Cr | Market Cap = ₹81,671 Cr
P/EV = ~1.54x
This is reasonable-to-cheap by Indian standards. Historically, quality private insurers have traded at 2–3x EV. At 1.5x, the market is pricing in modest growth, partly reflecting ICICI Pru’s ULIP-heavy mix (48% linked) which carries lower margins.
Price-to-VNB (P/VNB) — growth valuation
VNB = ₹2,629 Cr | Market Cap = ₹81,671 bn
P/VNB = ~31x
This needs to be read alongside VNB growth. With VNB growing only ~11% YoY and APE growing just 2.2%, 30x VNB is not cheap. Peers with faster VNB growth may command similar or higher multiples with better justification.
Return on EV (RoEV) — capital efficiency
RoEV = 11.9% (down from 13.1% in FY2025)
This is a concern. RoEV has been declining — from 17.4% in FY2023 to 14.1% in FY2024 to 13.1% in FY2025 and now 11.9%. At 11.9%, it’s barely above the cost of equity. The drag is coming from persistency variance (-₹2.64 bn) and operating assumption changes (-₹2.56 bn), both negative for FY2026. A P/EV re-rating to 2x+ would require RoEV recovering to 14–15%+.
3. What’s Working
VNB Margin expansion is the highlight — from 22.8% to 24.7% (+190bps).
Expansion came primarily from new business profile improvement (+3.4%) and economic assumptions (+2.5%), partly offset by operating assumption changes (-3.9%).
This is driven by a better product mix shift toward protection (18% of APE, retail protection up 32% YoY) and non-par.
Retail protection is the key bright spot — retail protection APE grew 32.3% YoY to ₹7.91 bn, partly aided by GST reforms. This is the highest-margin segment and its growing share is structurally positive for VNB margins.
Solvency at 227.3% is very comfortable, well above the 150% regulatory minimum. Zero NPA since inception is a balance sheet quality indicator.
Persistency — 13M at 84.5% (down from 89.1% a year ago) is the red flag worth watching. The decline in early-year persistency feeds directly into EV operating variance.
4. What’s Concerning
APE growth of only 2.2% is weak. Retail APE was flat (-0.1% YoY). Agency channel declined 10.5% YoY. The ULIP book (48% of mix) saw weak demand. This means the topline engine isn’t firing, and VNB improvement is coming from margin expansion rather than volume growth.
13M Persistency deterioration — from 89.1% (March 2025) to 84.5% (March 2026) is a meaningful drop. The EV movement analysis shows this caused a -₹2.64 bn drag (persistency and other variance). If this persists, it will cap EV growth.
RoEV at 11.9% is trending in the wrong direction. EVOP is healthy (₹57 bn) but the economic assumption change was a -₹7.78 bn drag, reflecting rising long-term interest rate assumptions (10Y reference rate moved from 7.2% to 8.4%).
AUM growth of only 1.4% reflects weak ULIP market performance, since policyholder funds track equity markets.
5. Conclusion
At 1.5x EV with a 24.7% VNB margin, the stock looks optically inexpensive versus its own history, but the weak APE growth, declining RoEV, and persistency pressures explain the market’s caution.
The re-rating catalyst would be: APE growth accelerating back to 10%+, persistency stabilizing, and RoEV recovering above 14%. The protection mix shift (now at 17.9% of APE vs. 15.7% last year) is a structural positive that supports margin durability.
Don’t like what you are reading? Will do better. Let us know at hi@moneymuscle.in
Don’t miss reading our Disclaimer