
GE Shipping FY25 Results: Earnings Dip, But Stock Trades at 30% NAV Discount
Despite a flat FY26, GESHIP offers deep value—0.69× P/B, 18% FCF yield, and 42% of market cap in cash—providing downside protection and re-rating potential
1. Shipping Company
greatship.com | NSE: GESHIP
Business Segments
🚢 Shipping Business (Core Segment)
Fleet Composition (as of Mar 31, 2025):
Crude Tankers: 5 vessels (~0.69 Mn DWT) – Suezmax & Aframax
Product Tankers: 17 vessels (~1.05 Mn DWT) – Primarily MRs
Dry Bulk Carriers: 12 vessels (~1.12 Mn DWT) – Supramax & Capesize
LPG Carriers: 4 vessels (~0.19 Mn DWT) – All time-chartered
🛢️ Offshore Business (via 100% subsidiary Greatship India Ltd)
Asset Base:
4 Jack-up Drilling Rigs
18 Support Vessels (PSVs, AHTSVs, MPSVs, ROVSVs)
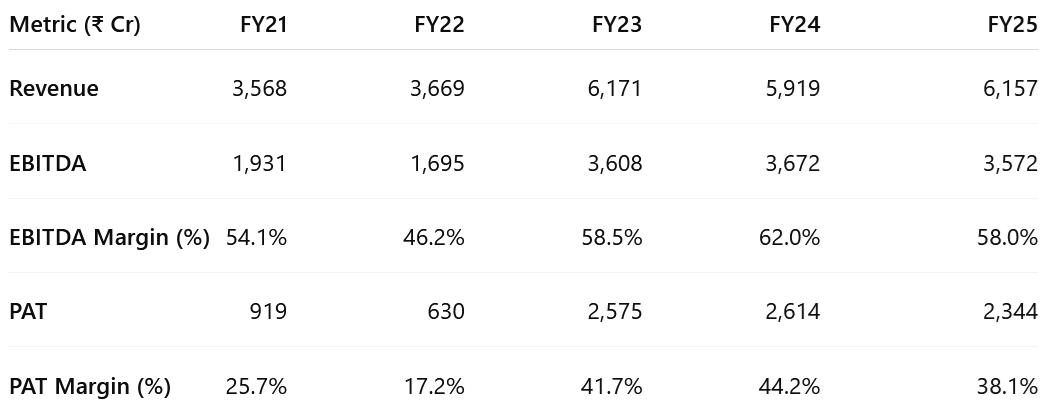
2. FY21-25: PAT CAGR 31% & Revenue CAGR 14%
3. Q4-25: PAT down 33% & Revenue down 2% YoY
PAT down 39% QoQ & Revenue up 9% QoQ
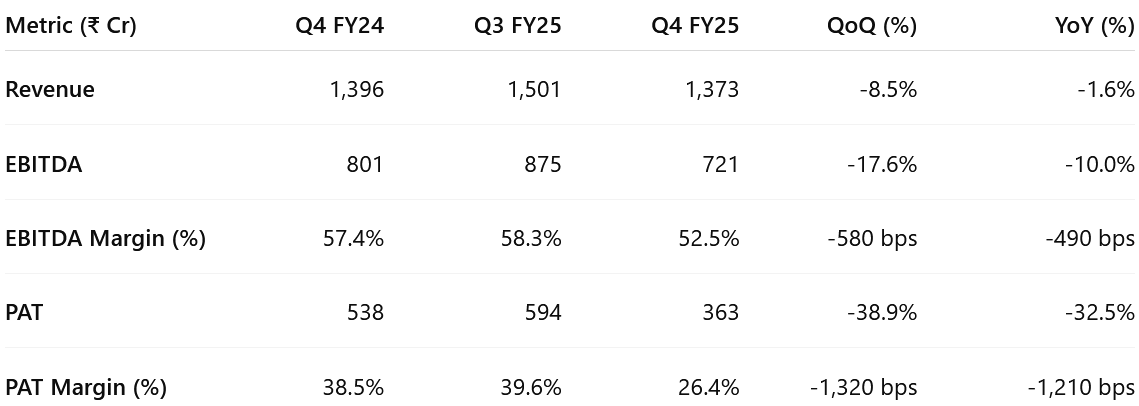
QoQ Decline: Revenue and EBITDA softened sequentially as tanker spot rates stayed subdued; PAT fell ~39% QoQ.
YoY Drop: Earnings normalised from a strong Q4 FY24 base (Red Sea disruption peak, rerouting-driven rates).
Margins: EBITDA and PAT margins remain healthy but off peak — cost controls and LPG time charters provided some cushion.
4. FY-25: PAT down 10% & Revenue up 4%
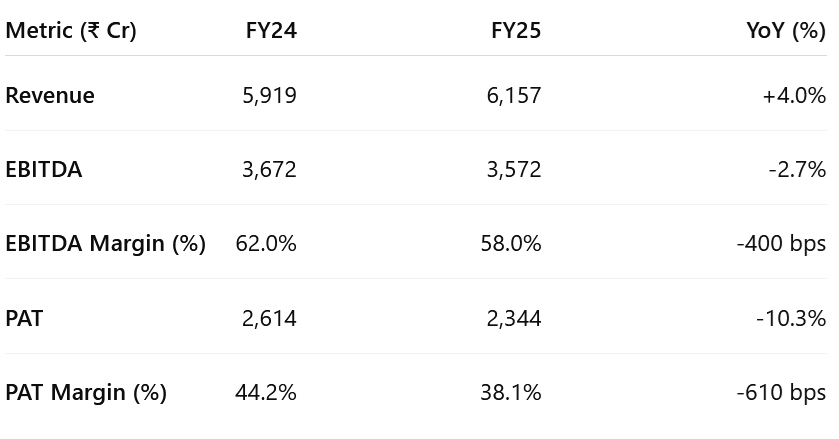
FY25 was a year of steady execution, cash preservation, and capital discipline, though earnings pulled back from FY24 highs. While the supernormal profit phase normalized, GE Shipping stayed resilient — positioning itself for counter-cyclical growth when valuations turn attractive.
5. Business Metrics: Muted Return Ratios
Strong capital discipline and fleet optimization strategy
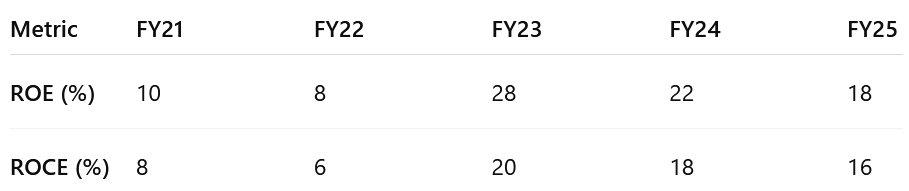
FY23 Upcycle Peak: High spot rates (post-Ukraine, Red Sea) and strong operating leverage from an owned fleet with minimal capex.
FY24–25 Normalization: Returns moderated but remained strong due to cost control, stable LPG charter income, and a net cash balance sheet.
6. Outlook: 60% Growth in FY26 with 50 bps margin expansion
6.1 FY-25 Expectations vs Performance — GE Shipping
✅ Hits in FY25
Resilient Revenue Growth: Revenue rose despite lower tanker rates — showing portfolio diversification (LPG, dry bulk).
Strong Cash Flows & Net Cash Position: Maintained >₹5,800 Cr net cash; conservative balance sheet enabled dividend continuity and capex flexibility.
Stable EBITDA: Despite market headwinds; margins held at 58%.
LPG Segment Support: All 4 LPG vessels on long-term charters delivered consistent, high-quality cash flows amid volatile tanker markets.
Efficient Capital Deployment: Avoided high-priced vessel purchases; took impairment hits conservatively; stayed patient on capital allocation.
Offshore Repricing Visibility: Secured 2 short-term contracts post-monsoon and 1 long-term ONGC contract — improving utilization outlook for FY26.
❌ Misses in FY25
PAT Decline: Lower spot tanker earnings and one-time asset impairments.
Earnings Normalization: End of FY23–24 supercycle peak.
Impairment on MR Tankers: ₹70 Cr write-down on 3 recently acquired product tankers due to falling asset prices.
No Major Asset Expansion: No accretive vessel additions despite healthy cash — impact of high secondhand prices and limited distress opportunities.
Tanker Rate Weakness: Crude and product tankers saw 30–40% YoY rate declines; Red Sea premium faded faster than expected.
6.2 Outlook for FY26 — GE Shipping
FY26 likely to be a consolidation year — stable operations, modest earnings visibility, and margin defense driven by LPG and offshore.
Shipping Business
Crude Tankers 🔄 Stable to Slightly Positive
Supported by long-haul Atlantic trade (US, Brazil, West Africa); volatility from Red Sea/Panama remains a tailwind.
Product Tankers 🔻 Soft
MR/LR2 segment faces pressure from orderbook and refinery self-sufficiency in Asia & Africa.
LPG 🔒 Stable
All 4 vessels on long-term charters → full revenue visibility.
Dry Bulk 🔼 Moderately Positive
Minor bulks (bauxite, alumina) and fleet supply tightness support earnings. Coal/iron ore may stay subdued.
Offshore (Greatship India)
3 rigs to operate in FY26:
2 short-term deployments post-monsoon
1 ONGC long-term contract starts Q4 FY26
1 rig remains active since FY25
Full-year contribution likely from Q3 onward, improving margins and utilization.
7. Valuation Analysis — GE Shipping
7.1 Valuation Snapshot
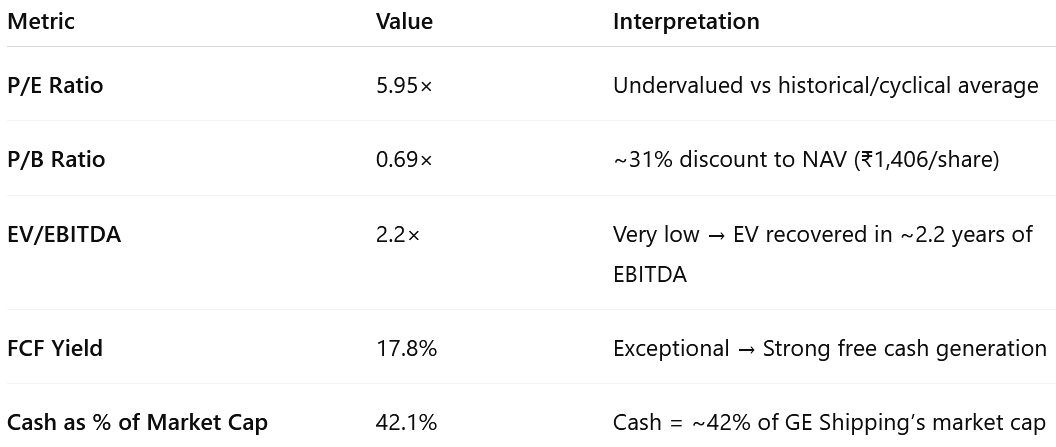
With cash equal to 42% of its market cap, EV/EBITDA at 2.2×, and FCF yield near 18%, GE Shipping offers rare value:
The stock is asset-backed, cash-rich, and earnings-capable.
Yet, it trades at levels that imply zero growth and no credit for future upside from offshore, freight volatility, or capital deployment.
7.2 What’s in the Price?
Stable Earnings Outlook:
At 6× P/E, the market prices in that FY25-level profitability is stable with limited earnings growth.No Credit for Upside Triggers:
Valuation reflects no benefit from offshore recovery, freight market spikes, or capital deployment.Asset Value Compression:
Recent MR tanker impairments (~₹70 Cr) and softening asset prices appear fully discounted.Cash Not Valued:
Despite holding ₹5,862 Cr in net cash (~42% of market cap), the stock trades at 0.69× P/B and 2.2× EV/EBITDA — implying the market expects this capital to remain idle.Steady-State Dividend Assumed:
With a 3% yield and consistent payouts, the market prices in continuation — not escalation — of returns.
7.3 What’s Not in the Price?
Capital Deployment Optionality:
₹5,800+ Cr in net cash gives GE Shipping the flexibility to buy assets, raise dividends, or repurchase shares — none of which are factored into current valuations.Offshore Monetization:
Three rigs are scheduled to be operational in FY26, including a long-term ONGC charter — yet offshore NAV remains unrecognized.Re-rating Potential:
A shift to 8× P/E or 1× P/B (in line with global peers) implies a 35–85% re-rating from current levels.Spot Rate Optionality:
Any supply-chain disruption (Red Sea, Panama, sanctions, tarriffs etc) could spike rates — GE Shipping, with high spot exposure, stands to benefit significantly.Bulk Market Support:
Structural demand in minor bulks and an aging global fleet add rate resilience not priced in.
7.4 Risks and What to Monitor
❗ Key Risks
Tanker Oversupply: New deliveries in MR/LR2 segments could weigh on rates.
Offshore Execution Delays: Deferred redeployment or renegotiated contracts would delay earnings recovery.
Asset Depreciation: Further decline in vessel values may compress NAV and trigger impairments.
Idle Cash Drag: Undeployed capital in a high inflation environment erodes shareholder value.
🔍 What to Track
Quarterly Charter Coverage (Crude, Product, Bulk)
Rig Redeployment Timelines and Day Rates
Buyback / Dividend Actions
Geopolitical Events Affecting Trade Routes
8. Implications for Investors
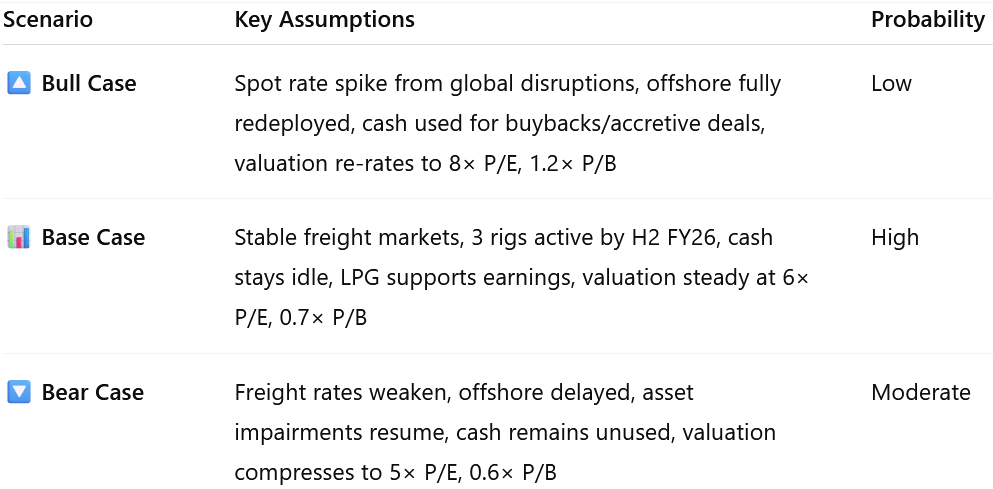
8.1 Bull, Base & Bear Scenarios — GE Shipping
8.2 Is There Any Margin of Safety?
Deep Value Metrics:
0.69× P/B, 5.95× P/E, 2.2× EV/EBITDA → all indicate underpricing of assets and earnings.Net Cash = Floor:
₹5,862 Cr in net cash (₹418/share) = 42% of market cap — a hard buffer against downside.Consistent Cash Flows:
₹2,472 Cr in FY25 FCF → 17.8% FCF yield, supporting dividend continuity and capital reinvestment.
🔐 Even in a downcycle, GE Shipping’s balance sheet strength, cash flow profile, and stable LPG income provide a durable margin of safety.
8.3 Where Is the Upside Potential?
Valuation Re-rating:
A shift to 8× P/E or 1× P/B lifts valuation by 35–85%, without needing earnings growth.Capital Levers Unused:
GE’s ₹5,800+ Cr cash pile offers optionality for buybacks, fleet additions, or higher payouts — levers the market doesn’t value today.Offshore Earnings Rebound:
3 rig deployments in FY26 will boost consolidated profitability and highlight underappreciated offshore NAV (~₹323/share).Event-Driven Upside:
Geopolitical or supply-chain shocks could reprice spot rates sharply — and GE is ideally positioned to capitalize.
📈 The upside lies in catalysts GE Shipping controls — capital, assets, execution — and external shocks it’s structurally built to benefit from.
Don’t like what you are reading? Will do better. Let us know at hi@moneymuscle.in
Don’t miss reading our Disclaimer