
EPack Prefab Technologies Q2 FY26 Results: PAT Up 105%, On-track FY26 Guidance
Outlook of 30-35% CAGR for FY25-27 with stable margins. Growth supported by order-book & structural tailwinds. Valuations don't discount the long-term opportunity
1. Prefab Solution Providers
epackprefab.com | NSE: EPACKPEB
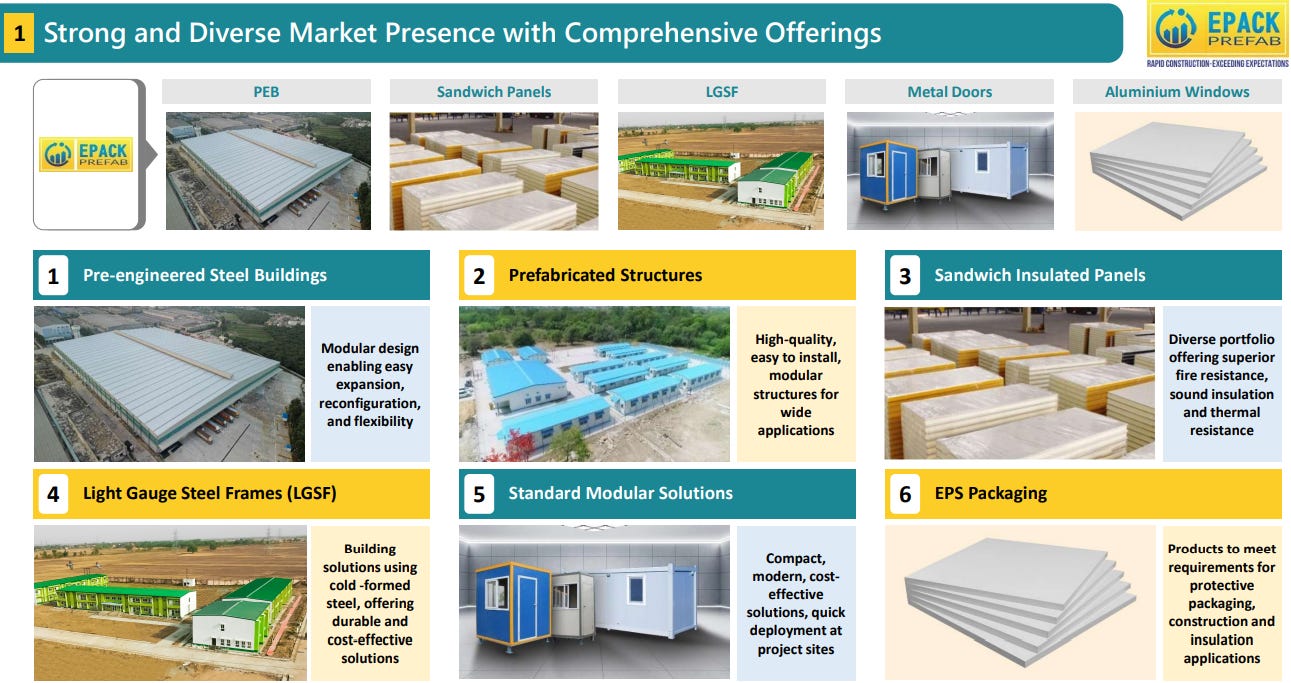
Business Verticals of EPack Prefab Technologies Ltd:
PreFab Business – Turnkey solutions for pre-engineered steel buildings and prefabricated structures, covering design, manufacturing, installation, and erection
EPS Packaging Business – Manufactures expanded polystyrene (EPS) sheets, blocks, and molded products used in construction, packaging, and consumer goods industries
Listed on 1st October 2025 on NSE and BSE
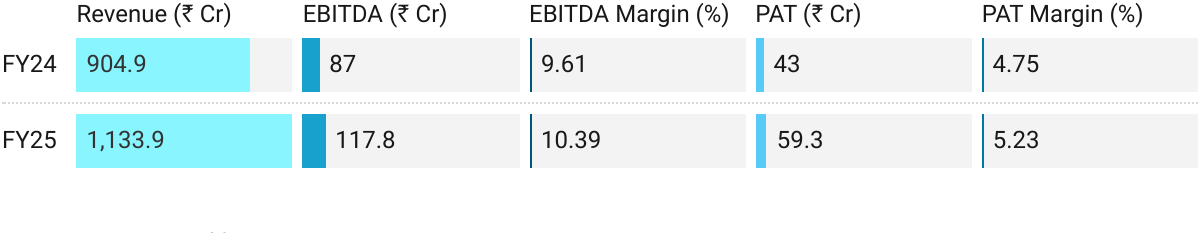
2. FY22-25: PAT CAGR of 45% & Revenue CAGR of 36%
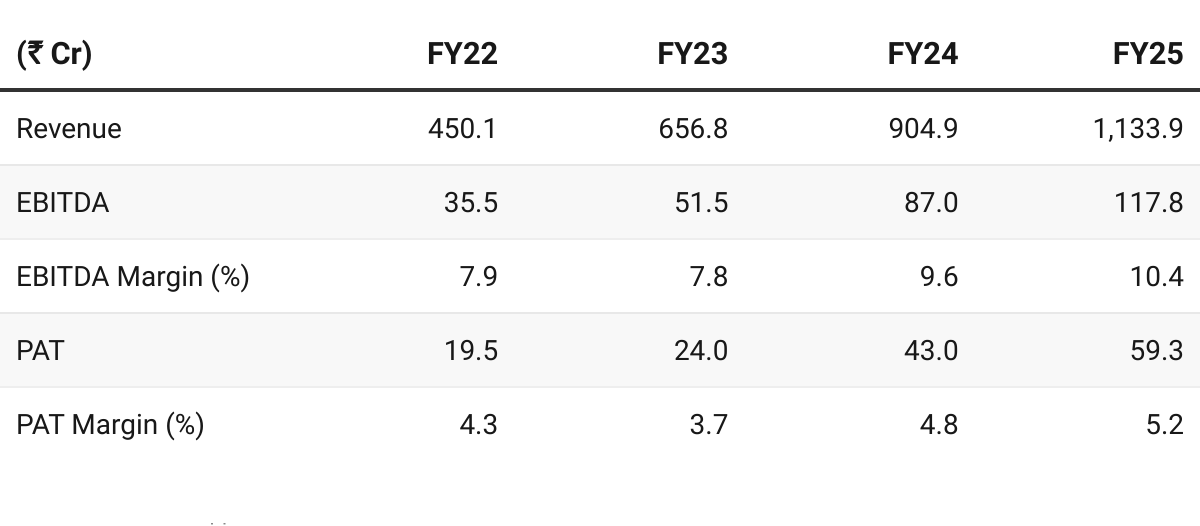
3. FY25: PAT up 38% & Revenue up 25% YoY
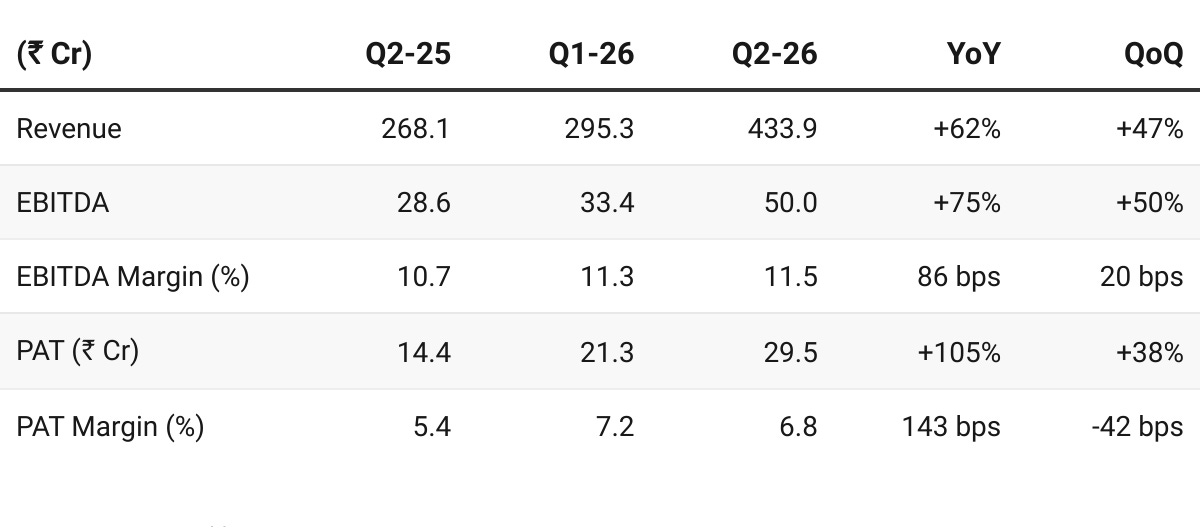
4. Q2-26: PAT up 105% & Revenue up 62% YoY
PAT up 38% & Revenue up 47% QoQ
Revenue growth — Strong order execution in prefab and panel businesses, aided by higher capacity utilization (≈88–90 %).
Improved project turnaround times boosted Q2 volumes.
Growth broad-based across solar, FMCG, warehousing, semiconductor, and auto sectors.
Segmental & Operational Highlights
Prefab business: ~90 % of revenue; maintained ~11 % EBITDA margin.
EPS packaging: Muted Q1 due to rains; improved in Q2 as consumer durables picked up.
Capacity utilization: 88 % in built-up sections; 75–80 % overall including cold-formed and roofing sections.
5. H1-26: PAT up 64% & Revenue up 36% YoY
PAT up 44% & Revenue up 22% HoH
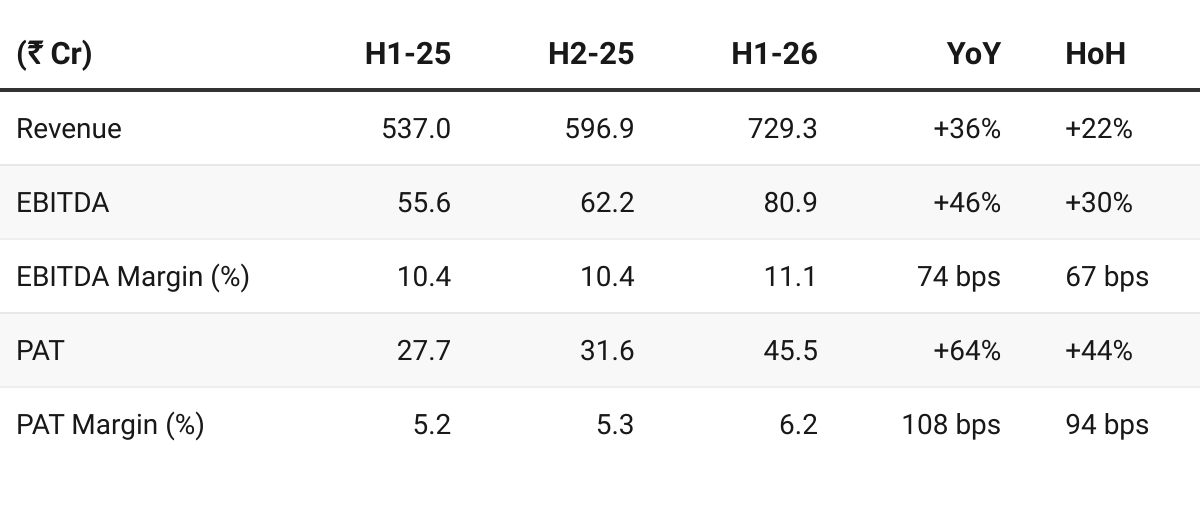
Strong Revenue Growth — despite weather-related execution challenges in Q1.
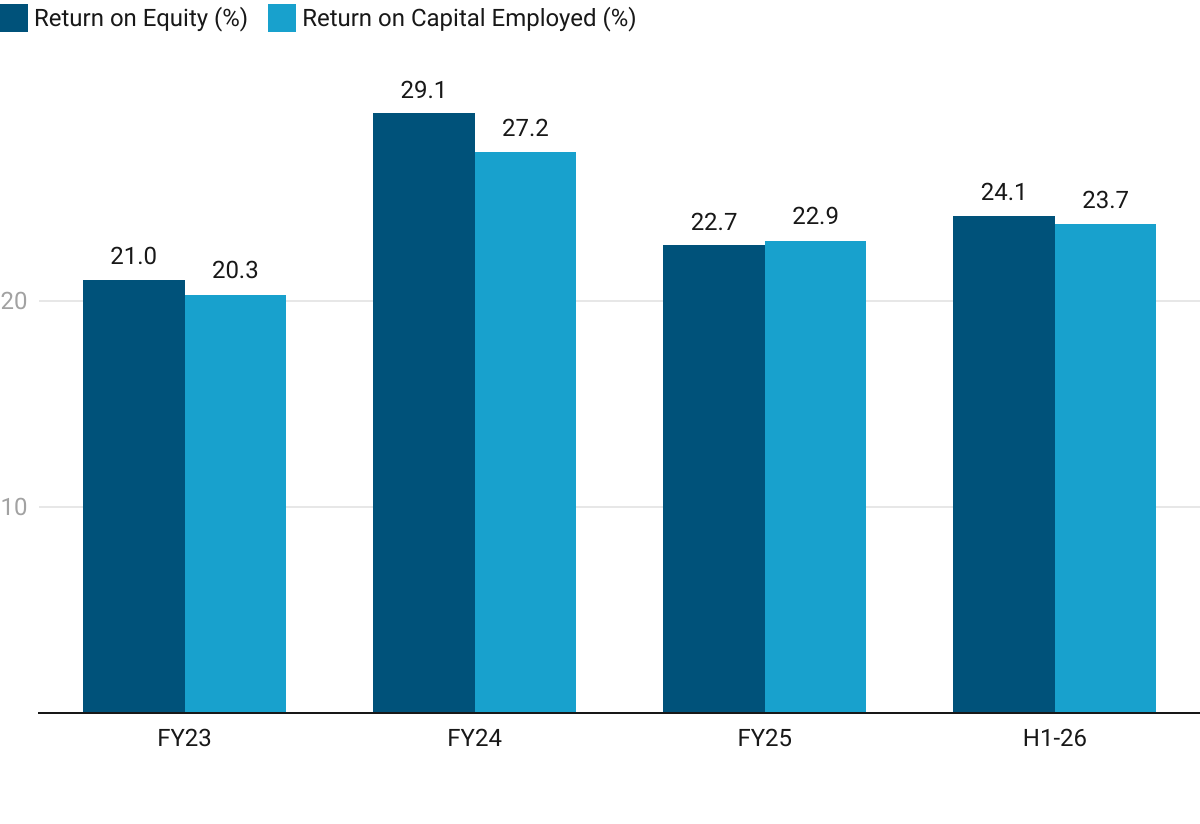
6. Business Metrics: Strong Return Ratios
7. Outlook: FY25-27 CAGR of 30-35%
7.1 Management Guidance and Future Outlook
Growth: guidance of 30%-35%
Order-book: As we speak, like the Company has an order book of around Rs. 920 crores. So, in our business, the order book gives clear visibility of the revenue for the next 7 months to 8 months
When it comes to revenue, then for us, the first half is around 45% of the annual revenue and the second half contributes about 55%.
EBITDA: For the margin expansion, we will continue to maintain at 10.5 to 11.5. Reason being that our strategy in the last 3 years and for the next 2 years as well is going to be market penetration strategy.
PAT: about 0.3% expansion should happen
Capacity Expansion and Scale-Up Plan
Mambattu (AP) — Brownfield (₹ 58 Cr), Start in Q4 FY26
Will add +28–32 k MT PEB capacity ≈ ₹ 300 Cr topline
Ghiloth (Rajasthan) — Greenfield (₹ 102 Cr) Commissioning in Q2 FY27
+8 lakh sqm sandwich-panel capacity ≈ ₹ 250 Cr topline
Combined expansion adds ₹ 550–₹ 600 Cr incremental revenue potential from FY27 onward.
Strategic Priorities (FY27–FY30 Horizon)
Expand market share from ~5.5 % → 10 % + in India’s prefab industry.
Deepen presence in high-growth verticals — data centers, EV & battery, renewables, and clean rooms.
Explore exports to Middle East, Africa, and SAARC markets from Mambattu plant (port proximity).
Leverage sustainability trend: certified PUF / sandwich panels position EPACK in the green-building segment.
Industry Tailwinds Supporting Long-Term Growth
Shift from RCC to prefab as industries demand speed, scalability, and sustainability.
India’s CAPEX cycle accelerating across manufacturing, infrastructure, and logistics.
Green-construction focus and ESG-linked funding driving demand for energy-efficient prefab structures.
Government push for Make-in-India, smart cities, and renewable energy enhances sector visibility.
Long-Term Outlook (Post FY27)
The larger opportunity will play out beyond FY27, as prefab adoption rises structurally across industrial, warehousing, and commercial segments.
7.2 H1 FY26 vs FY26 Guidance
Revenue Slightly Ahead, Profitability On-track
Revenue trajectory: H1 revenue at at around 45% of full-year suggests the possibility of EPACKPEB delivering 30%+ growth for FY26.
Order book: Orders of ₹920 Cr supports revenue growth run-rate in H2-26
Profitability: Both EBITDA and PAT are in-line with the guidance.
Capex Progress: Mambattu expansion started ; Ghiloth site civil work begun
Capex on-schedule to support growth for FY27 and FY28
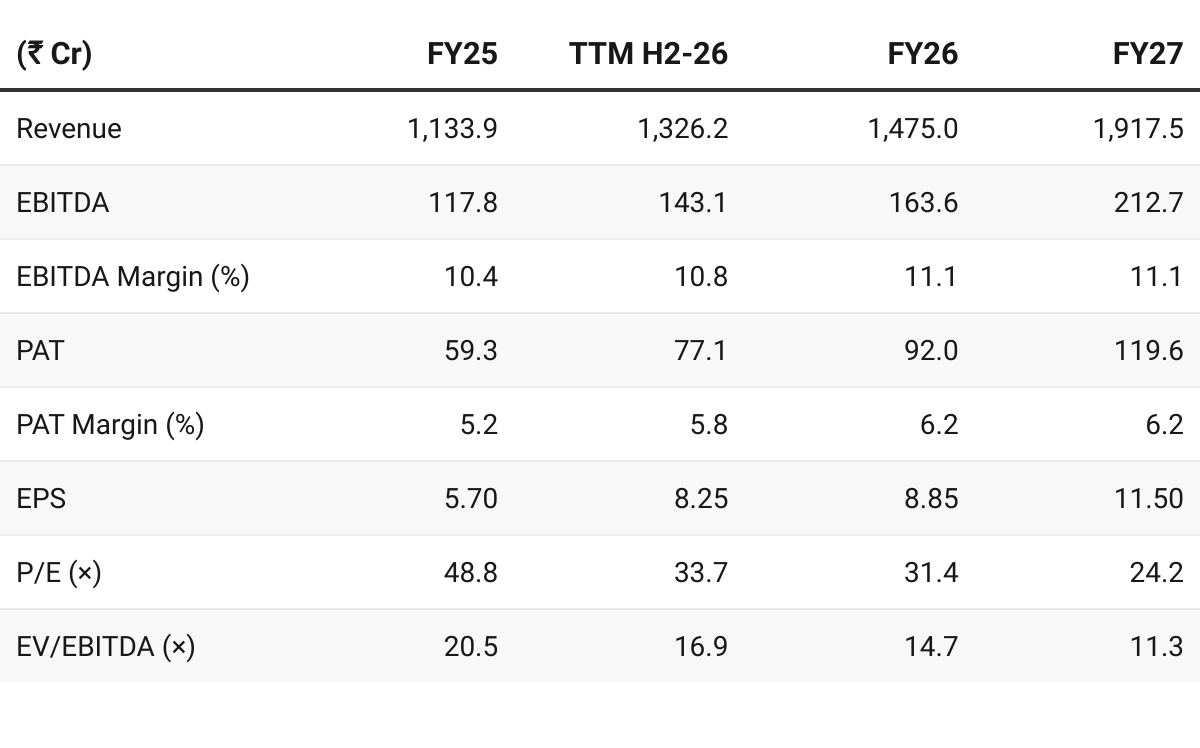
8. Valuation Analysis
8.1 Valuation Snapshot
CMP ₹278; Mcap ₹2,697.99 Cr
Margins: Sustained ant the levels of H1-26
EPACKPEB generated ₹60.6 Cr of free cash flow in H1 FY26
Available at free cash-flow yield of 2.25% (not annualized) on current market cap of ₹2,697.99 Cr which makes the valuations quite reasonable.
Planned capex will be approximately around ₹160cr (funded from IPO).
TTM (H1-26) — Fair, fully pricing near-term growth
FY26E —Pricing in the 30% growth for FY26
FY27E 24.0 P/E (x), 11 EV/EBITDA (x) — Creates opportunity for re-rating
Trades near fair value on current earnings but offers opportunity based on FY27
8.2 Opportunity at Current Valuation
Structural shift toward prefab: Prefab/PEB forms only 3–5 % of India’s construction market. Rising preference for faster, cost-efficient, sustainable construction creates a long runway beyond FY27.
Industry tailwinds: Multi-year industrial CAPEX upcycle, driven by renewables, semiconductors, EVs, data centers, logistics, and Make-in-India infrastructure push — all heavy prefab users.
Capacity-led growth visibility: CAPEX (Mambattu + Ghiloth) to lift PEB capacity by ~28 % and panel capacity by ~60 %, unlocking ₹550–₹600 Cr annual revenue potential from FY27.
Green and export opportunity: Certified insulated panels open entry into green buildings; port-proximate Mambattu facility to drive exports to Middle East & Africa from FY27 onward.
Valuation re-rating potential: At FY27E P/E 24×, EV/EBITDA 11×, EPACK trades at growth at reasonable price levels; sustained 30–35 % growth and prefab adoption beyond FY27 could drive further re-rating.
EPACK is set to benefit from India’s prefab inflection point — near-term growth from new capacity, and structural opportunity beyond FY27 as prefab replaces conventional construction across industries.
8.3 Risk at Current Valuation
Ability to execute the guidance
Limited track record: Q2-26 was the first quarter of EPACKPEB as a public company and one needs to assess the execution track-record
Execution and Ramp-up Delays: Any delay in commissioning the Mambattu (Q4 FY26) or Ghiloth (Q2 FY27) facilities would mute growth
Raw-Material Volatility: Steel constitutes 80–85 % of raw-material cost. Sharp price swings could compress margins despite EPACK’s partial hedging through short order cycles and inventory buffers.
Order-Book Concentration and Demand Cyclicality: ~95 % of business is from private-sector clients; a slowdown in industrial CAPEX or consumer durables could affect order inflows. Diversification into exports and new sectors is still nascent
Valuation and Re-rating Risk: At ~31× FY26E earnings, near-term upside depends on sustaining 30 %+ growth and consistent margins. Any earnings miss or working-capital stretch could trigger de-rating toward peer multiples (20–25× P/E).
Don’t like what you are reading? Will do better. Let us know at hi@moneymuscle.in
Don’t miss reading our Disclaimer