
Elecon Engineering Q1-26 Results: Profit Up 139%, Supported by One-offs; FY26 Guidance on Track
On track for FY26 guidance. Q1 aided by domestic demand, MHE, and one-offs. Exports and gear margins were a drag. FY26E valuations leave little room for error.
1. Among Asia’s Largest Industrial Gear Solution Company
elecon.com | NSE: ELECON
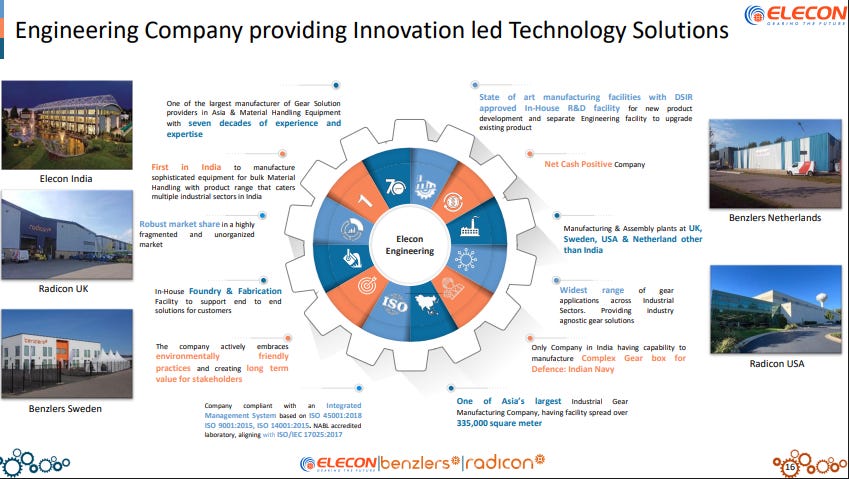
Business Segments
2. FY21–25: PAT CAGR of 63% & Revenue CAGR of 21%
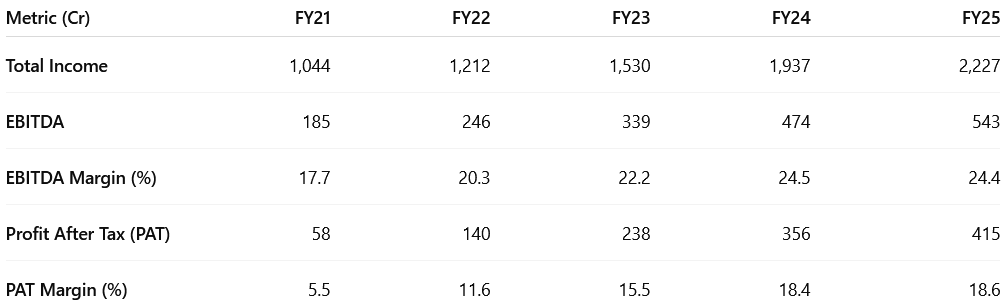
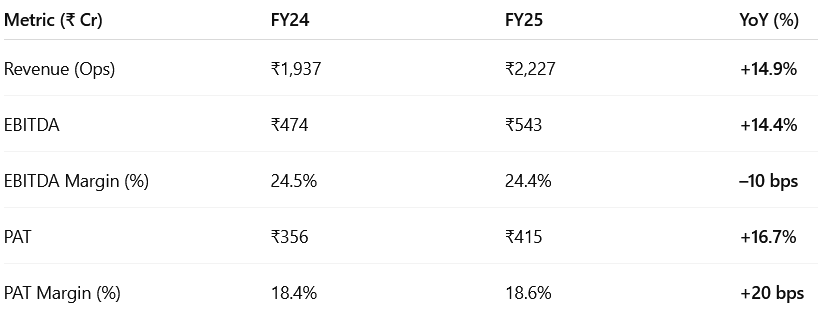
3. FY25: PAT up 17% & Revenue up 15%
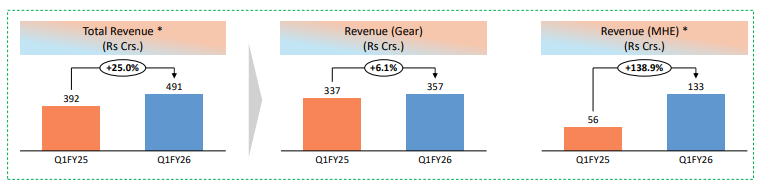
4. Q1-26: PAT up 139% & Revenue up 25% YoY
PAT up 20% & Revenue down 38% QoQ

Revenue: (+25% YoY) — aided by ₹25 Cr arbitration gain in MHE.
PAT: (+139% YoY), includes ₹80 Cr exceptional gain and ₹10 Cr other income from arbitration.
Gear Division
Revenue: (+6.1% YoY) — steady but slower than previous quarter.
Margin fell to 18.4%. Impacted by higher employee cost, branding in Europe, and depreciation from new plant.
Engineered products fell to 43% of revenue (normal is ~50–55%), denting profitability.
Order Intake: ₹480 Cr (+21% YoY), strong visibility into H2.
Material Handling Equipment (MHE)
Revenue: (+139% YoY); includes ₹25 Cr one-off.
Order Intake: ₹134 Cr (−10% YoY), but open orders up 14.6% YoY.Deferred orders expected in Q2.
Resilient Domestic Market: Up 41% YoY; strong traction in steel, power, cement.
Overseas Revenue: ₹124 Cr (−7% YoY) — impacted by Middle East softness.
Order Book: ₹1,110 Cr (+17.2% YoY) — provides forward visibility.
Strategic Clarity
Focused on product + service in MHE (no EPC), OEM ramp-up, and exports — all aligned with long-term goals.
One-off Heavy Quarter: ₹115 Cr of non-operational gains (₹25 Cr revenue, ₹10 Cr other income, ₹80 Cr exceptional) boosted reported PAT — not sustainable run-rate.
CapEx Still Ramp-Up Phase
₹25 Cr of machinery yet to be capitalized; benefits from full CapEx cycle not yet reflected in earnings.
Elecon delivered a strong Q1-26 performance with 25% revenue growth and 139% PAT surge, driven by robust domestic demand, a high-margin MHE mix, and one-time gains. However, export softness and gear margin pressures slightly tempered the underlying momentum.
5. Return Metrics: ROE & ROCE Remain Strong
Capital Efficiency, Operating Leverage, and Growth Without Dilution

FY25 return ratios remain strong, even after absorbing higher depreciation from capex and increased branding investments in Europe.
Margins sustained at healthy levels (EBITDA margin ~24.4%) despite upfront expenses on capacity expansion and OEM onboarding.
Capital productivity continues to improve, supported by:
₹550 Cr net cash position
Strong cash flow from aftermarket and service segments
Tight working capital management
Capex execution without equity dilution or debt addition has preserved shareholder returns.
FY26 return ratios expected to remain strong as operating leverage from the new facilities kicks in from FY26 onward.
6. FY26 Outlook: Muted Growth supported by one-offs

Revenue growth of 19%
FY26 revenue target: ₹2,650 Cr (does not include ₹25 Cr arbitration income).
EBITDA growth of 17%
Management expects to grow at ~25% CAGR over the next 3 years.
International revenue goal: Generate 50% of consolidated revenue from exports by FY30.
OEM business and aftermarket services are expected to be key global growth drivers.
Gear Division
Margins to normalize to 24–25% from Q2 FY26 onward.
Engineered product mix (currently 43%) expected to return to normal levels (50–55%) from Q2.
MHE Division
FY26 revenue guidance: ₹650 Cr.
Sustainable EBITDA margin: 23% over next 2–3 years.
Export momentum building: $1.8M order expected in Q2; larger $12M+ deal expected in Q4 or early FY27.
Order Book & Visibility
Orders executable in 6-month cycles; high visibility through FY27 in both domestic and export markets.
Continued strong demand from steel, cement, power, and growing traction in defense.
Management commentary after Q1-25 Results: Resilient performance in the quarter… On track to reach Rs. 2,650 crores Revenue for FY26…
7. Valuation Analysis — Elecon Engineering
7.1 Valuation Snapshot

Derived from FY26 management guidance of ₹2,650 Cr revenue, ₹636 Cr EBITDA and same PAT margin (18.6%) as FY25.
P/E Ratio
TTM P/E: 26.8× reflects optimism around Elecon’s recent earnings growth and future profitability.
FY26E P/E: 28.1× implies that the market is pricing in:
Margin normalization in gear division (to ~25%),
OEM business ramp-up,
Realization of defense + export opportunities.
However, at ~28× forward P/E, the valuation leaves little room for execution slippage.
EV/EBITDA
FY25 EV/EBITDA: 24.9× → high for a mid-cap industrial company.
TTM and FY26E multiples (23.3×, 20.9×) still reflect premium expectations, backed by:
24%+ steady-state margin guidance,
₹400 Cr capex to unlock ₹500 Cr+ revenue,
High aftermarket/service mix in both MHE and Gears.
P/S Ratio
P/S near 6× is rich unless business has SaaS-like margin + growth + recurring revenue profile.
In Elecon’s case:
30–40% of revenue is high-margin service/aftermarket,
MHE margins are robust (41% services in Q1),
OEM exports and defense can compound sales non-linearly.
Valuation Red Flags
Valuations leave little room for error. Any disappointment in:
Gear margin normalization,
Defense order delays,
OEM ramp-up,
Export disruptions, could trigger a de-rating toward historical medians.
Valuation is rich but not irrational. It's:
Justified if Elecon executes flawlessly on OEM, defense, and exports.
Vulnerable to macro/geopolitical shocks or margin compression.
A 30x P/E business needs visible, recurring cash flows and scalable global growth — Elecon is on that path, but market is already pricing in 70–80% of that upside.
7.2 Opportunity at Current Valuation
Growth visibility
Track-record of growth with ROE >20% and ROCE ~27%.
TTM PAT growth strong; FY26E PAT expected to grow ~18%, backed by OEM, defense, and exports.
Asset-Light Execution
₹400 Cr capex funded without debt or dilution; use of ROU assets boosts capital efficiency.
Net cash of ₹550 Cr ensures scalability without weakening return ratios.
Underpenetrated Global Potential
Currently ~25% export mix; target to reach 50% by FY30.
OEM business just starting to scale; commercial ramp from Jan 2026 offers non-linear upside.
Recurring, High-Margin Revenue
Aftermarket + refurbishment: 41% of MHE and 32% of gear division revenues in Q1 FY26.
Service revenue is sticky, cash-generative, and less cyclical.
Optionality from Defense & OEM
₹200 Cr defense order expected in FY26; ₹1,000+ Cr pipeline.
OEM contribution guided at ₹70–100 Cr in FY26, with visibility to ₹150–200 Cr medium term.
💡 If PAT compounds at 20%+ CAGR beyond FY26, current P/E of 26.8x (TTM) and 28.1x (FY26E) may still deliver superior risk-adjusted returns.
7.3 Risk at Current Valuation
Rich Valuation: Little room for margin or execution slip
TTM P/E: 26.8×, EV/EBITDA: 23.3×
FY26E P/E: 28.1×, EV/EBITDA: 20.9×
.Execution Dependence
OEM, defense, and export-led thesis must execute on tight timelines.
Gear margins (Q1: 18.4%) need to recover to 25%+ to support forward estimates.
Geopolitical Fragility
Q1 exports declined 7% YoY due to Middle East delays; future volatility can't be ruled out.
Large portion of OEM + MHE export pipeline tied to Europe, Middle East, and U.S.
Tariffs situation not clear as of now
Capex Risk
₹400 Cr capex (of which ₹25 Cr pending capitalization in Q2) needs flawless ramp-up.
Delay in revenue conversion could pressure margins and returns.
One-off Heavy TTM Earnings
TTM PAT includes ₹90 Cr+ of arbitration + reclassification gains.
Adjusted earnings could be 15–18% lower than reported, making valuation look higher than it appears.
📉 For a mid-cap cyclical business, 28x P/E assumes near-perfect execution. Any delay in OEM scale-up, margin compression, or order delay may lead to sharp multiple compression.
Previous coverage on ELECON

Don’t like what you are reading? Will do better. Let us know at hi@moneymuscle.in
Don’t miss reading our Disclaimer