
Aeroflex Industries FY25 Results: PAT Up 26%, Eyes 25%+ FY26 EBITDA Growth
Aeroflex targets ₹1,000 Cr revenue by FY29 with 27% CAGR and margin gains from premium mix. Stock fully prices perfect execution, leaving no room for error.
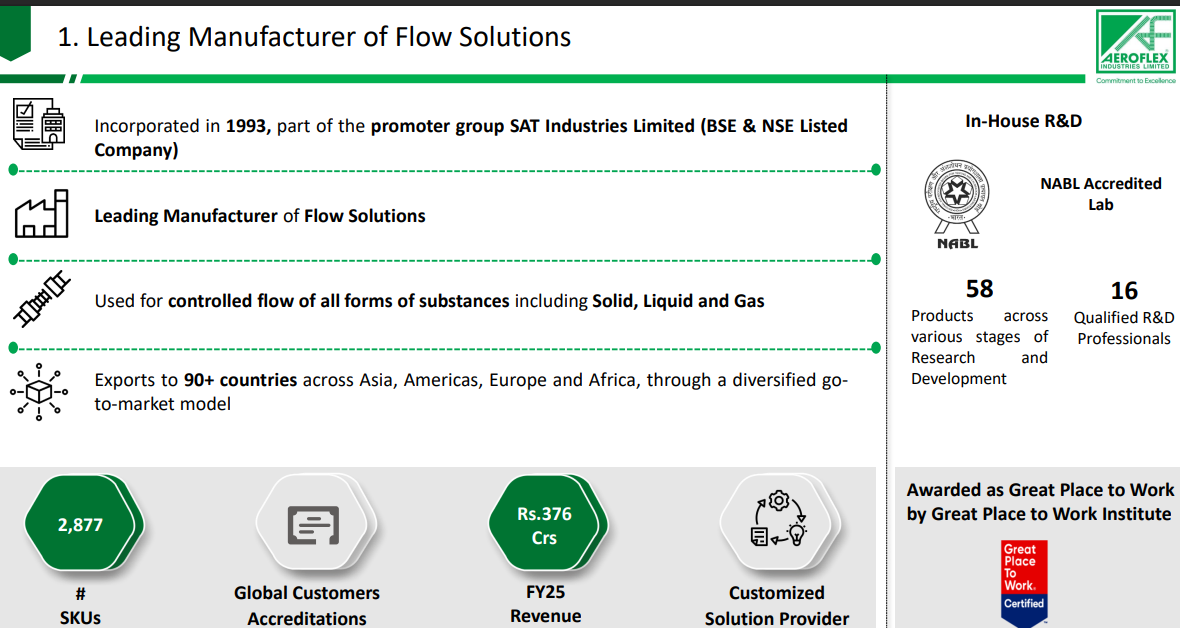
1. From Stainless-steel Hose Maker into Flow Solutions Provider
aeroflexindia.com | NSE: AEROFLEX
Business Segments
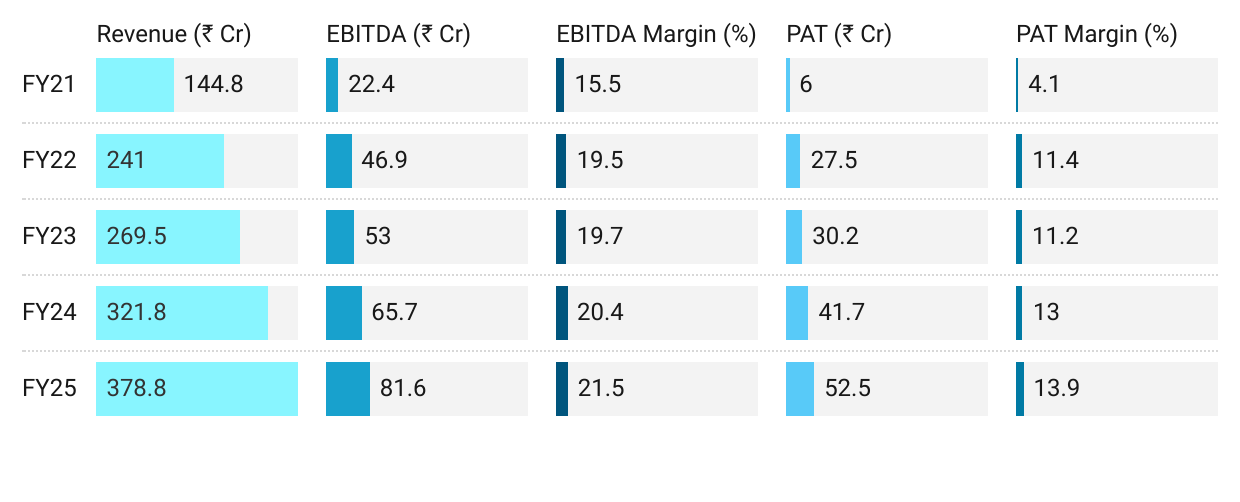
2. FY21-25: PAT CAGR 66% & Revenue CAGR 27%
2.1 What Changed Between FY21 and FY25
Stronger Financials: Revenue growth + Margin Expansion
Product Mix Shift
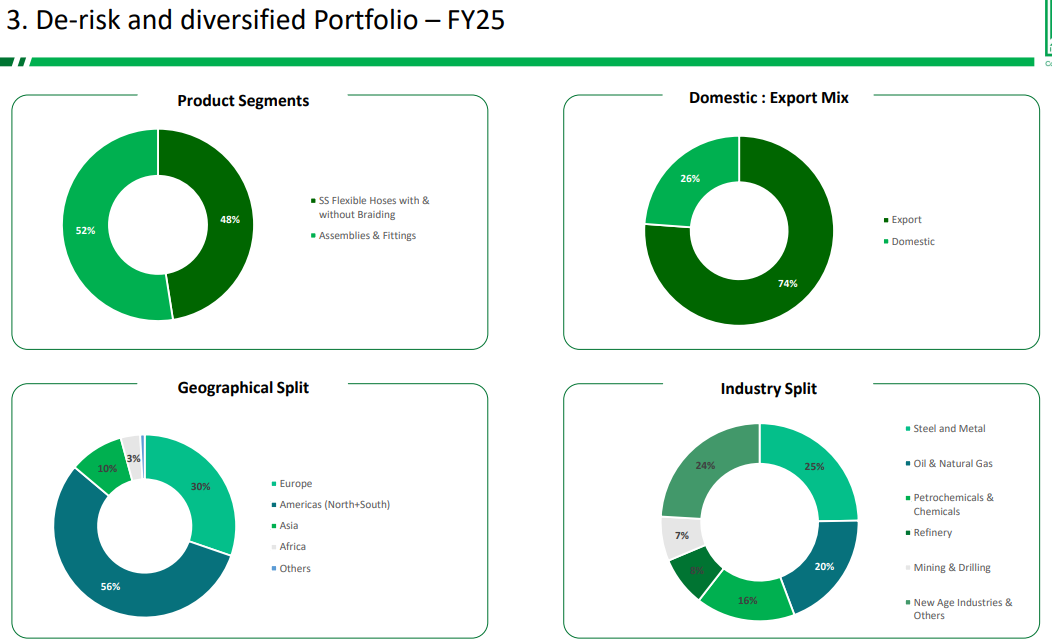
SS hoses dropped from >70% to <48% of revenue.
Assemblies and fittings now contribute 52.5%, driving higher margins and customer stickiness.
Exports: Share increased from ~65% to 74%.
Capacity expanded: From ~8.5 mn to 16.5 mn meters.
New Growth Engines:
Launched metal bellows; miniature bellows underway.
Expanded into composite hoses, solar, robotics, and fire safety segments.
Hyd-Air Acquisition: Vertical integration into fittings and entry into railways, shipbuilding, heavy industries.
3. Q4-25: PAT up 12% & Revenue up 18% YoY
PAT down 26% QoQ & Revenue down 8% QoQ
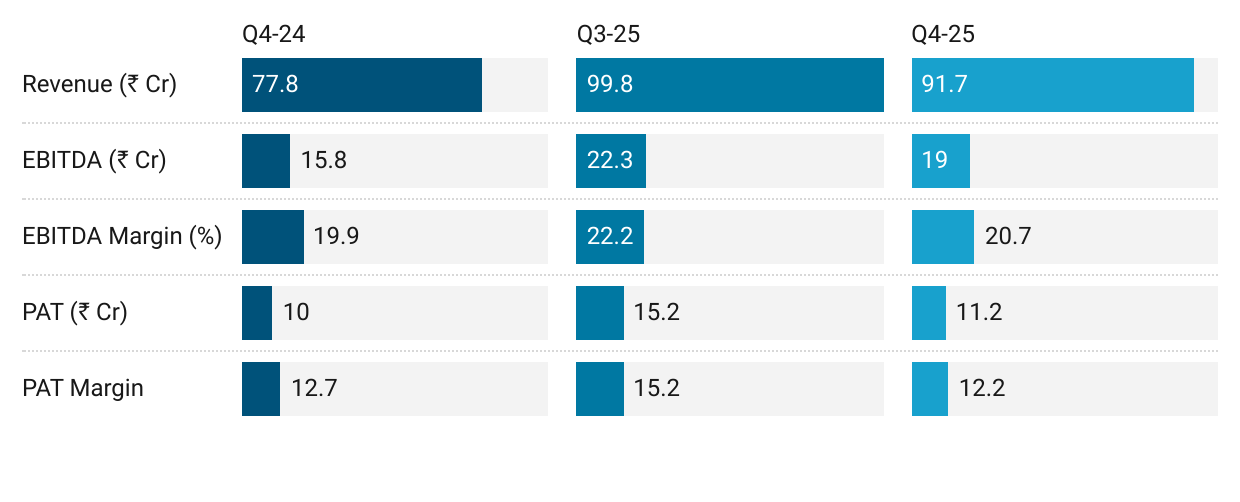
QoQ Decline: External logistics challenges — delayed shipments tied to Red Sea
Margin declines: Cost absorption on lower volumes.
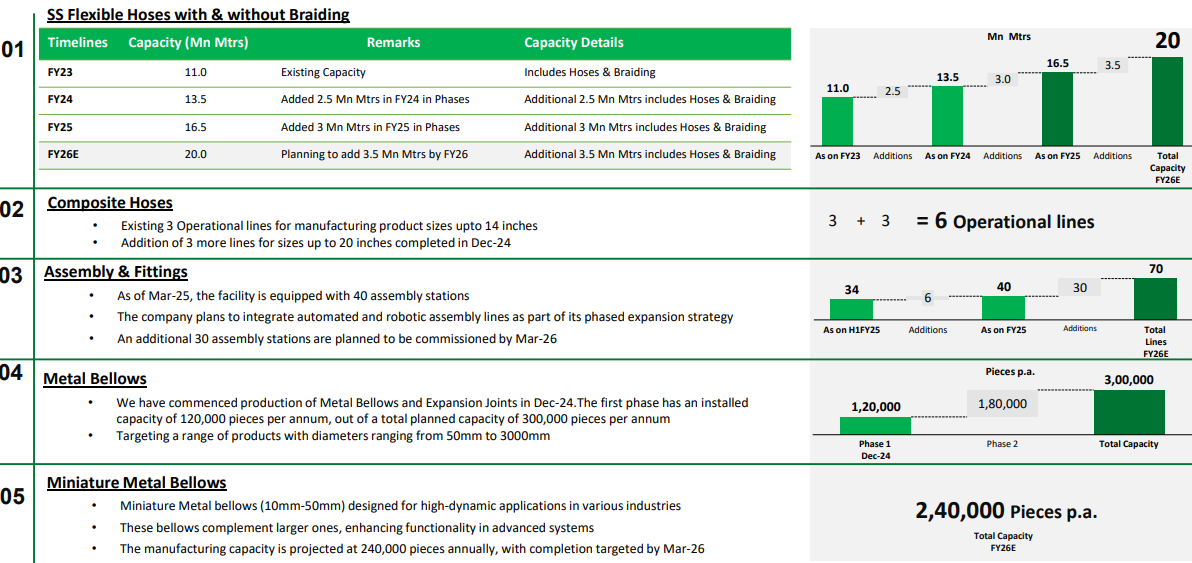
Assembly stations scaled to 40, supporting higher value-added product mix.
Metal bellows production commenced in Dec 2024 (Phase 1: 1.2 lakh pieces).
Composite hose capacity expanded to 6 operational lines.
Capacity utilization: 75% for SS flexible hoses.
4. FY-25: PAT up 26% & Revenue up 18%
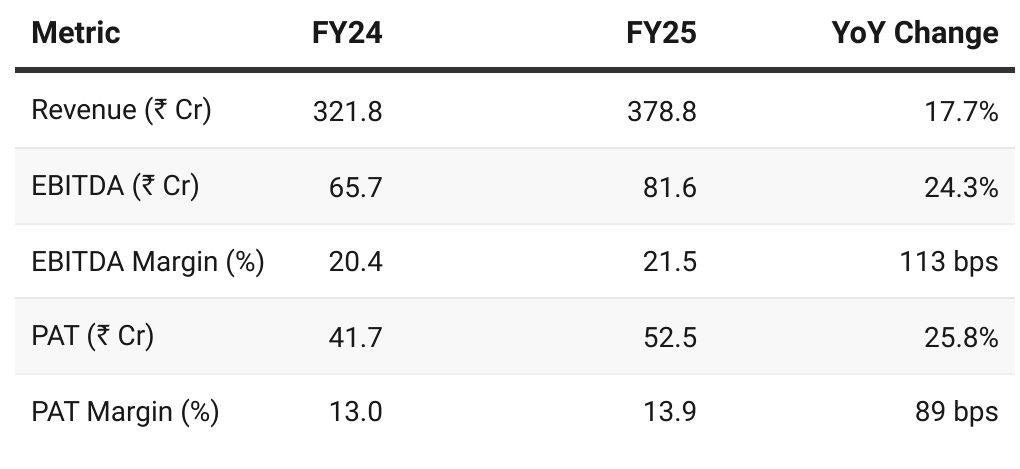
Assemblies & Fittings grew to 52.5% of revenue, overtaking SS hoses (47.5%).
Revenue driven by both volume scale and mix shift to high-value assemblies.
Capacity expanded from 13.5 mn to 16.5 mn meters; 20 mn planned by FY26.
Bellows and miniature bellows: Capex completed; commercialization in progress.
5. Business Metrics: Muted Return Ratios
Front-loaded capex and balance sheet expansion
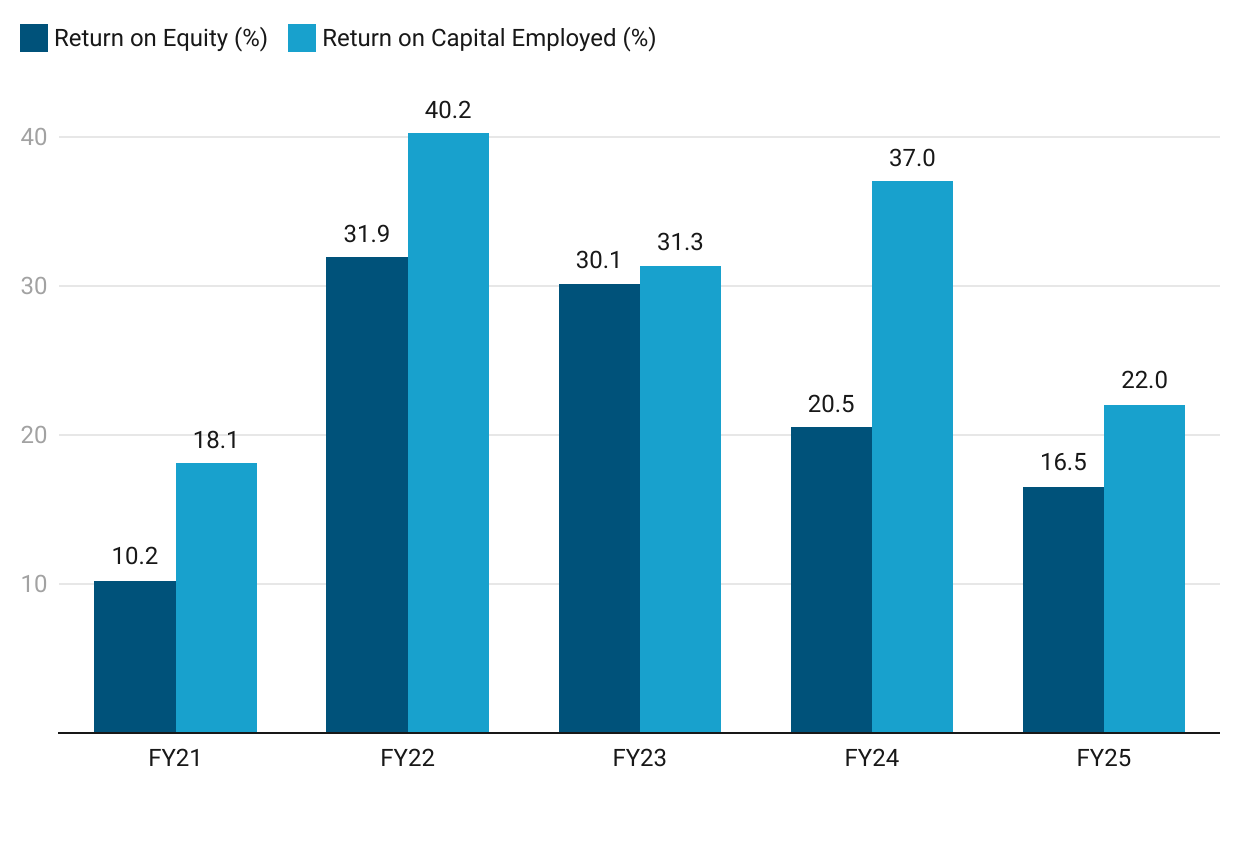
Decline in ROE/ROCE is temporary: Driven by front-loaded capex and balance sheet expansion, not operational weakness.
ROCE still strong at 22%: Indicates assets are being monetized well, even before full bellows/automation scale-up.
Returns expected to rebound: As high-margin bellows, miniature parts, and composite hoses begin contributing from FY26 onwards.
6. Outlook: 25% EBITDA Growth in FY26 with 100 bps margin expansion
6.1 FY-25 Expectations vs Performance — Aeroflex Industries
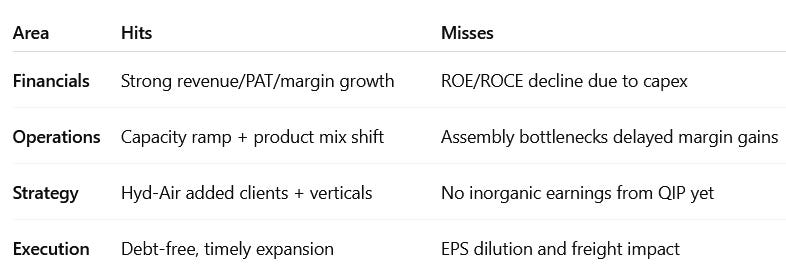
✅ Hits
Strong revenue and PAT growth with 100 bps margin expansion.
Assemblies grew to 52.5% of revenue, boosting product mix and profitability.
Hose, bellows, and composite capacities commissioned on time.
Hyd-Air acquisition integrated, adding marquee clients and new verticals.
Debt-free operations with all FY25 capex funded internally.
❌ Misses
ROE fell to 16.5% and ROCE to 22% due to underutilized capex.
Manual assembly constraints limited full margin realization.
Red Sea disruption led to higher freight costs and revenue deferral.
6.2 Outlook for FY26 — Aeroflex Industries
Overall Outlook:
Our strategic focus continues to be on high-margin and value-added products, particularly in the assemblies and now the Metal Bellows division, which we expect to be the key growth drivers for the company for the next few years
FY26 Guidance:
Focus remains on increasing the profitability
Growth in our profitability in terms of EBITDA would be close to 25%,
At least a 100 basis point increase in the margin.
Capex to support Growth:
Revenue Target: ₹1,000 Cr by FY29
7. Valuation Analysis — Aeroflex Industries
7.1 Valuation Snapshot
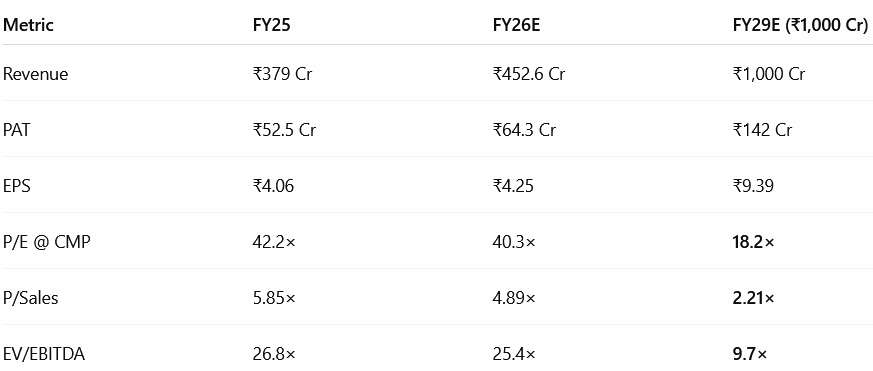
If Aeroflex reaches ₹1,000 Cr revenue by FY29 with stable margins, EPS will more than double, and at CMP will reflect ~18× P/E. That’s fair-to-attractive, especially given the asset-light, global export model and improving product mix. Valuation will look very reasonable — but depends heavily on 3-year execution across:
Bellows + composite hose ramp
Inorganic revenue realization
Margins and ROCE holding
7.2 What’s in the Price?
The current price reflects execution certainty over the next 3–4 years:
FY26 PAT of ₹64–65 Cr and timely ramp-up in assemblies and bellows.
Sustained 25% PAT CAGR through FY29; implied forward P/E of ~40×.
Efficient use of ₹350–400 Cr QIP for accretive acquisitions or backward integration.
Full capex monetization by FY28 with organic revenue of ₹750–800 Cr.
₹1,000 Cr revenue by FY29, supporting FY29 EPS of ₹9–10 and P/E compression to ~18×.
The stock prices in perfect execution — with no margin for slip-ups.
7.3 What’s Not in the Price?
Several upside levers remain underappreciated:
QIP-funded M&A: Inorganic revenue not yet factored into FY27–28 PAT.
Miniature bellows, a niche high-margin vertical, will scale post-FY27.
Valuation re-rating to 30–35× P/E is possible if PAT crosses ₹100–125 Cr by FY27.
Sector tailwinds from EVs, hydrogen, AI cooling, defense, and solar offer new revenue streams.
Strategic partnerships or global acquisitions could expand scale and scope materially.
7.4 Risks and What to Monitor
Execution Risk: Bellows certification or volume delays may defer ₹85–90 Cr revenue.
M&A Integration: Acquisitions must deliver >18–20% ROCE; otherwise, dilution won’t pay off.
Valuation Risk: If margins compress or PAT CAGR slows, current 40× P/E could de-rate sharply.
Export Dependence: 74% export share exposes Aeroflex to freight, currency, and tariff shocks.
Product Concentration: Assemblies/fittings dominate growth; quality or client issues can affect earnings disproportionately.
🔴 Execution must match expectations — there’s little buffer for underperformance.
🔎 What to Monitor
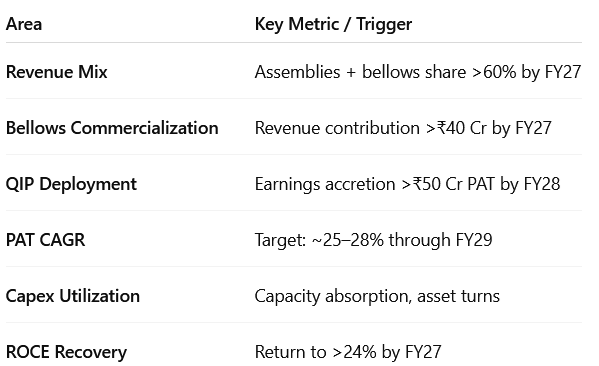
Management must execute on both organic scale and inorganic returns, while protecting margins. The valuation leaves little room for delays — but rewards for outperformance remain high.
8. Implications for Investors
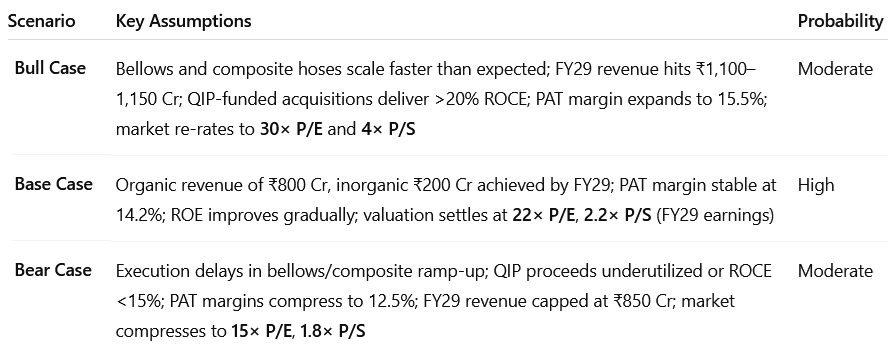
8.1 Bull, Base & Bear Scenarios — Aeroflex Industries
8.2 Is There Any Margin of Safety?
🔍 Where There Is Margin of Safety
✅ 1. Business Quality & Model
Export-driven (~74% revenue), asset-light, high-margin model (FY25 EBITDA margin: 21.5%)
Strong tailwinds from global demand in aerospace, AI cooling, and industrial automation
In-house R&D, certified manufacturing, and diversified product portfolio (2,800+ SKUs)
✅ 2. Capital Structure
Zero net debt, with QIP providing ₹400 Cr growth capital
Strong ROCE track record (22% in FY25, expected to rise post-monetization of capex)
Clean balance sheet gives flexibility to absorb shocks or delays
✅ 3. Execution Levers Not Priced In
Bellows, composite hoses, and miniature bellows offer non-linear margin expansion
Inorganic revenue from acquisitions (₹150–200 Cr) may add PAT without equity dilution
Valuation compresses sharply on FY29 earnings (P/E drops to ~18× from current ~42×)
✅ If growth plays out, today’s valuation implies you’re buying Aeroflex at FY29–30 earnings levels, effectively locking in future earnings at a reasonable multiple.
❌ Where There Isn't Margin of Safety
⚠️ 1. Valuation Today Is Rich
P/E FY25: 42.2×
FY26: Still elevated at 40.3× even post PAT growth
Market is pricing in execution perfection for 3–4 years ahead
⚠️ 2. Execution Risk Exists
Bellows need scaling + certification approvals
Inorganic integration must deliver 20%+ ROCE to justify dilution
Any delay or cost overrun could compress margins and delay PAT growth
⚠️ 3. No Cushion for Disappointment
A miss in FY26 PAT or margin compression in FY27 would push P/E above 45–50×
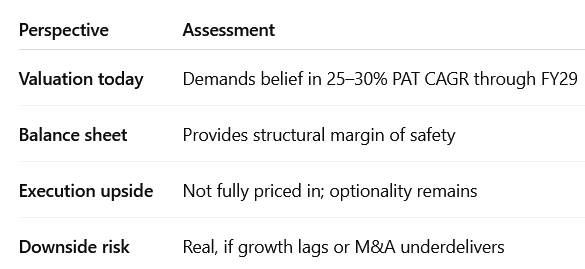
Margin of safety lies in the business — not in the stock price. You’re paying for future execution, but if the company delivers, you're locking into FY29 earnings at ~18× — and that’s the true margin of safety.
Don’t like what you are reading? Will do better. Let us know at hi@moneymuscle.in
Don’t miss reading our Disclaimer